Figures & data
Figure 1. The concept of loudness coding with dynamic current focussing (DCF) and monopolar (MP) stimulation. The upper bar for each loudness step shows the auditory nerve with the excitation pattern in grey. The lower bars show the implanted electrode array with the electrode contacts in grey. In the DCF strategy, the amplitudes of the main and neighbouring electrode contacts are increased equally up to the threshold level (T-level). To increase the loudness from the T-level, σ is decreased as a function of the stimulus level, resulting in a broader excitation pattern and higher loudness level. In MP mode, the amplitude of the main electrode contact is increased as a function of the stimulus level, resulting in broad current spreads at all loudness levels. M-level, most comfortable level.
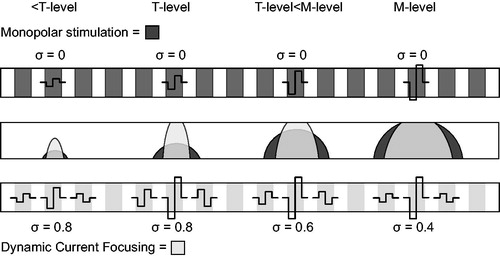
Table 1. Characteristics of the study subjects.
Figure 2. Individual loudness growth functions on an 8-point loudness scale (y-axes). The stimulus levels were calculated as follows: where
was calibrated for each electrode contact using BEPS + software. For understanding speech, the loudness levels “2” (very soft sound) to “5” (the most comfortable loudness) were considered the most relevant. This loudness range is shaded in grey. The areas under the curves (AUCs) are indicated for the two strategies. DCF: dynamic current focussing.
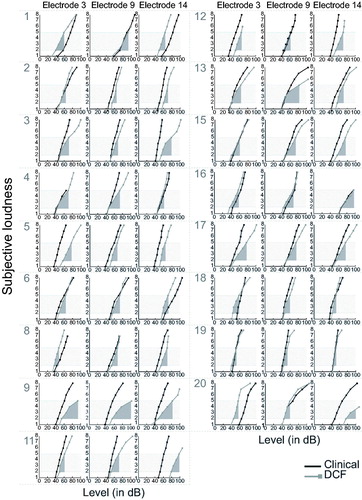
Table 2. Differences in the areas under the loudness curves (ΔAUCs) between the two strategies for each subject at the indicated electrodes.
Figure 3. Individual and mean spectral ripple thresholds at 45 dB (a) and 65 dB (b) for the 17 study subjects using their monopolar (MP) clinical strategy (baseline and control measurements) and dynamic current focussing (DCF). Error bars represent ± 1 standard error of the mean.
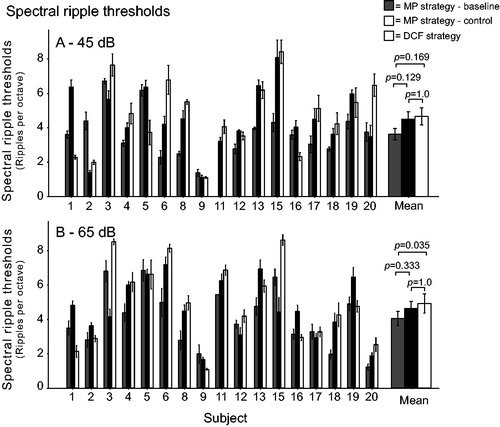
Figure 4. Individual and mean modulation detection thresholds (MDTs) for the 17 study subjects at 65 dB SPL, using their monopolar (MP) clinical strategy (baseline and control measurements) and dynamic current focussing (DCF). Error bars represent ± 1 standard error of the mean.
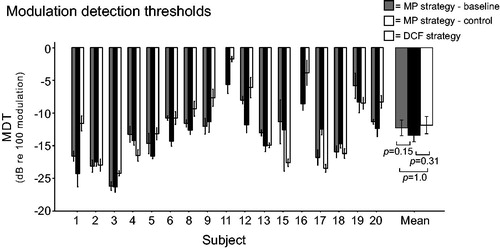
Figure 5. Individual and mean speech intelligibility in noise (Dutch Matrix test) with fixed speech at 45 dB SPL (a) and 65 dB SPL (b) for the 17 study subjects using their monopolar (MP) clinical strategy (baseline and control measurement) and dynamic current focussing (DCF). The y-axis is the speech-to-noise ratio for which 50% of the words were repeated correctly. Error bars represent ± 1 standard error of the mean.
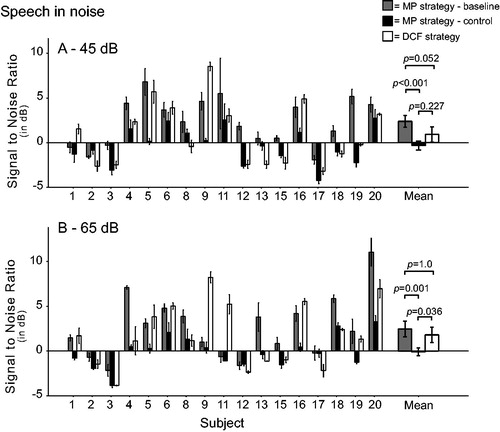
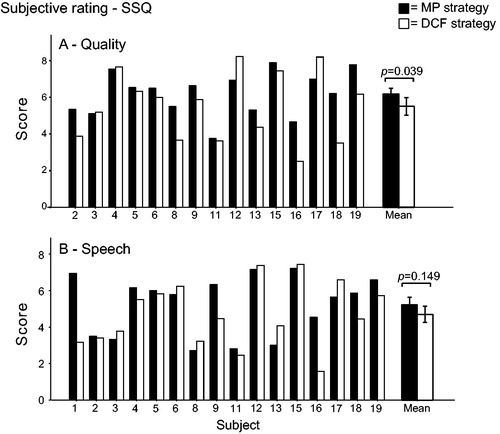
Figure 6. Subjective rating of processing strategies (SSQ) concerning quality of sound (a) and speech understanding under multiple listening conditions (b).