Figures & data
Figure 1. Contralateral responses (two sub-averages) from CI08 (MED-EL Concerto Flex 28 – FS4) showing (A) Response before processing (prior to filtering and artefact removal) that is very large in amplitude-BAR containing an excessive high-frequency artefact, (B) LP filtered response (300 Hz) that is smaller in amplitude than (A) with no high-frequency artefact, (C) artefact that was estimated from the LP filtered response and (D) final response after artefact removal that is much smaller in amplitude-PAR than (A) and (B) and contains speech-ABR characteristics combined with residual artefact. *Note that in order for the response to be visible in all subplots, the y-axis scale is not equal across sub-plots.
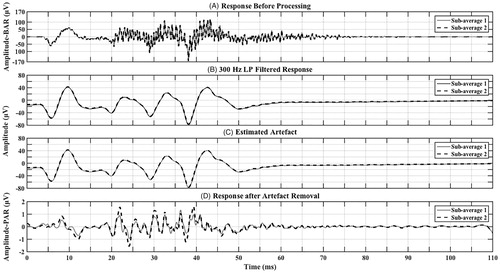
Figure 2. Contralateral responses (two sub-averages) from CI08 (MED-EL Concerto Flex 28– FS4) showing (A) Estimated artefact (as in ) with axes adjusted for better visualisation (x-axis from 0 to 70 ms). Triangles point to major peaks that are closest in latency to detected peaks in (B). Latencies are marked for each peak. Amplitudes (μV) are as follows 68.67 (first positive to first negative peak), negative peaks to preceding positive peak = 62.25, 76.73 and 66.98, respectively. (B) Response after artefact removal (as in ) with axes adjusted for better visualisation (x-axis: 0–70 ms, y-axis: −1.8–1.8 μV). Triangles point to potential speech-ABR peaks V, A, D, E, F and O, respectively. Latencies are labelled for each peak. Amplitude-PARs (μV) are as follows positive V to negative A = 0.96, D = 3.13, E = 1.12, F = 2.31 and O = 1.19 (measured as preceding positive peak to negative peak).
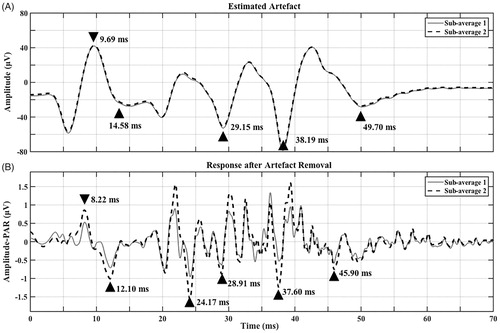
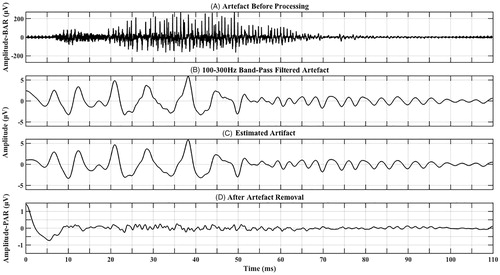
Figure 3. Artefact recorded based on a close approximation to CI08’s MAP showing (A) artefact before processing (prior to filtering and artefact removal) that is very large in amplitude-BAR containing an excessive high-frequency artefact, (B) Band-pass filtered artefact (100–300 Hz) that is smaller in amplitude than (A) with no high-frequency artefact, (C) artefact that was estimated from (B), and (D) final response after artefact removal that is much smaller in amplitude-PAR than both (A) and (B) suggesting that most of the artefact has been removed. *Note that in order for the response to be visible in all subplots, the y-axis scale is not equal across sub-plots.