
Figures & data
Figure 1. Outline of the auralisation procedure (see Section 2.1. for more details). A complete description of the Spatial Decomposition Method (SDM) has been described by Tervo et al. (Citation2013). The panoramic photo of the listening room is adapted from Ojansivu (Citation2017).
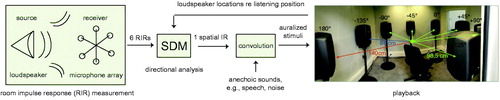
Table 1. T20, C50, IACCE3/L3, STI and D/R values for each room.
Figure 2. Hearing thresholds of all individual participants (grey lines) and the average thresholds of normal-hearing (NH; PTA < 25 dB HL) and hearing-impaired (HI; PTA ≥ 25 dB HL) groups. The pure-tone average (PTA) scores are calculated as the average over both ears and at 500, 1000, 2000 and 4000 Hz frequencies. The individual lines have been horizontally displaced to improve their visibility in the figure.
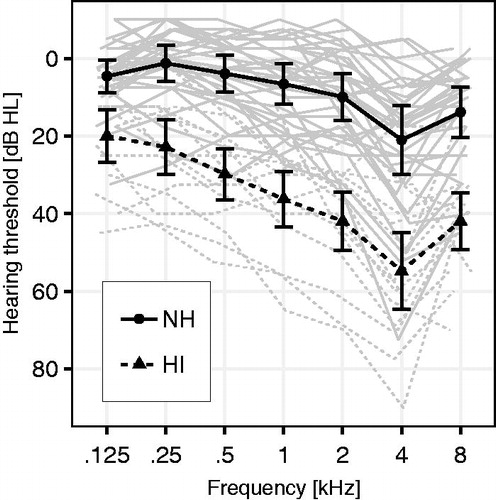
Figure 3. (a) Normal hearing: Averages and standard deviations per test condition. (b) Hearing-impaired: Median and the 25th and 75th percentiles per test condition. Whiskers extend maximally to 1.5 times the inter-quartile range. (c) Pure-tone average (PTA; 500–4000 Hz; both ears) scores plotted against the SRT results for each test condition. The vertical dotted line depicts the 25 dB HL PTA cut-off for normal hearing. Ref: Grey squares; Room 1: Red points; Room 2: Blue crosses.
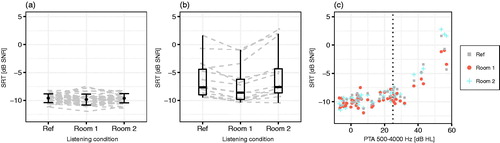
Figure 4. Hearing aid benefits per individual and test condition.
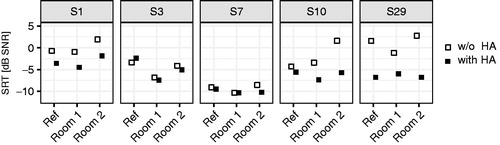
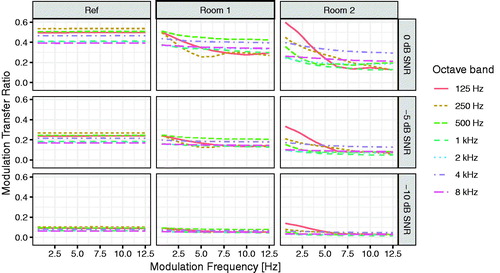
Figure 5. Modulation transfer ratios for each room and SNRs of 0, −5 and −10 dB. The values are calculated by using RIRs and a single randomly selected sentence from the Finnish Matrix Sentence Test.
Data availability statement
The data that support the findings of this study are available on request from the corresponding author, A.K. The data are not publicly available due to the nature of this study.