
Figures & data
Figure 1. Self-reported fatigue scores (VAS-F) for individual participants before and after performing the digits-in-noise-task. Solid lines represent increased VAS-F scores after task performance. Dashed lines represent decreased VAS-F scores after task performance.
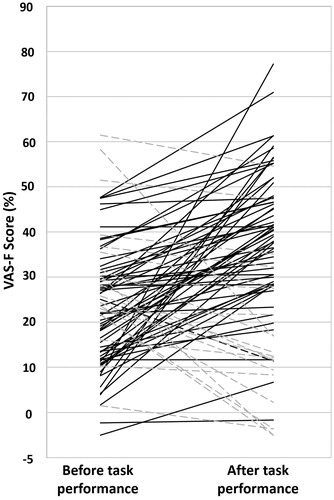
Table 1. Pattern matrix: Factor loadings of the variables to each factor in the VAS-F.
Table 2. Pattern matrix: Factor loadings of the variables to each factor in the NASA-TLX.
Figure 2. Time in seconds (0–1 sec: pre-stimulus period, 1–4 sec: speech presentation period, 4–6 sec: retention period) is shown on the x axis. Panel a shows mean (black line) pupil diameter during the 1-second pre-stimulus period. The shaded grey area represents ±1 SE. Panel b shows the mean change in pupil diameter, relative to pre-stimulus baseline during the speech presentation period and during the retention period. The shaded grey area represents ±1 SE. PPD: peak pupil diameter.
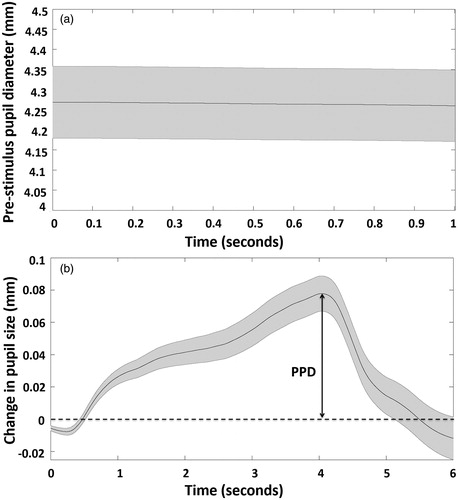
Table 3. Correlation coefficients (Pearson’s [r], 1-tailed significance) for the dependent (peak pupil diameter and pre-stimulus pupil diameter) and independent variables (PTA, age, VAS-1: tiredness/drowsiness, VAS-2: energy, VAS-3: exhaustion and physical fatigue, NASA-1: workload, NASA-2: performance, Task performance (RAU)) entered into the regression models.
Figure 3. a. Relation between partial regressions for pre-stimulus pupil diameter and a sub-dimension of self-reported fatigue (VAS-1; tiredness/drowsiness), when hearing level and age are taken into account. Smaller pre-stimulus pupil diameter is associated with increased self-reported fatigue. b. Relation between partial regressions for pre-stimulus pupil diameter and performance, when hearing level and age are taken into account. Larger pre-stimulus pupil diameter is associated with increased performance accuracy.
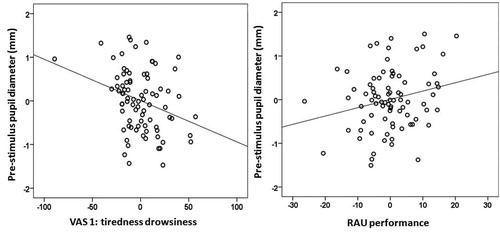
Table 4. Model 2: Linear model predictors (PTA, age, VAS-1: tiredness/drowsiness, task performance) of pre-stimulus pupil diameter.