
Figures & data
Table 1. Summarising table of the literature review in the introduction incorporating the SSQ.
Table 2. Descriptive statistics of all variables included in the study for the normally hearing and the hearing aid users.
Figure 1. Audiograms for the older normally hearing adults on the left and the hearing aid users on the right. Error bars depict 95% CI.
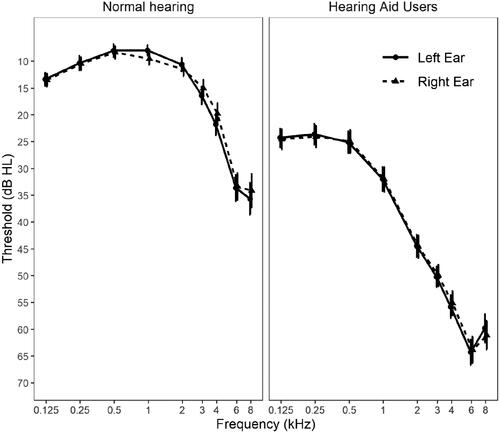
Figure 2. The correlation between the HINT and the self-report scores of the Quality subscale of the SSQ.
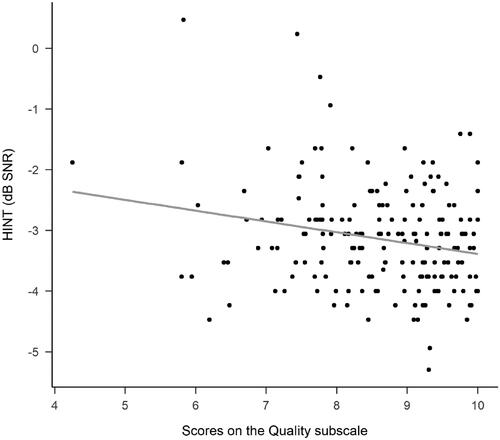
Figure 3. The correlation between the HINT and the self-report scores of the Speech subscale of the SSQ.
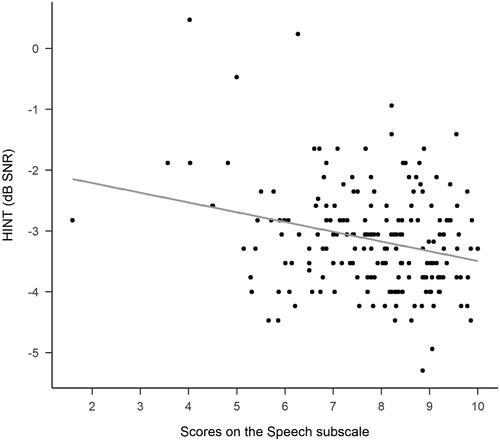
Table 3. Correlations between the subscales of the SSQ, total SSQ score, speech in noise tests, and PTA4.
Table 4. Correlations between speech in noise tests and the items in the Speech subscale of the SSQ.