
Figures & data
Figure 1. The study flow. HA : Hearing Aid; IOI-HA: International Outcome Inventory for Hearing Aids; HEARLI-Q: Hearing-Related Lifestyle Questionnaire; COSI: Client Oriented Scale of Improvement; EMA: Ecological Momentary Assessment.
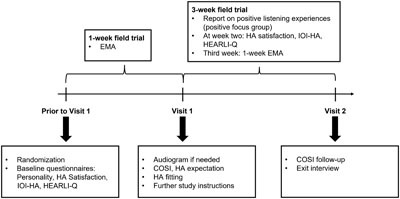
Table 1. EMA questions and response alternatives.
Table 2. Comparison of baseline characteristics between the two groups.
Figure 2. The average number of submitted positive reports per participant, per day.
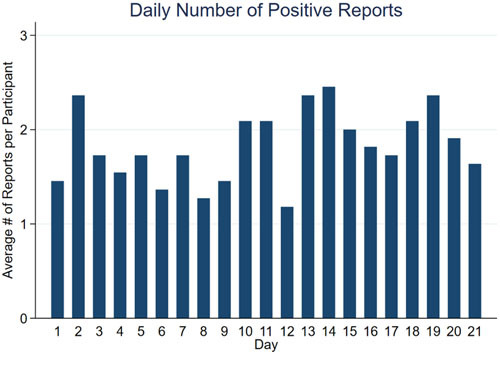
Figure 3. Two weeks post-fitting hearing aid outcome scores on the four scales. The EMA satisfaction ratings were averaged within each individual prior to box plot visualisation, in order to give each participant the same weight. The significant differences are indicated by *(p <.05) and **(p <.01).
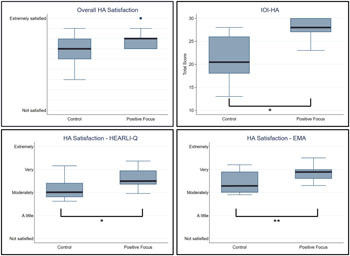
Table 3. Regression analyses results.
Figure 4. COSI ratings at the second visit. The median of COSI ratings was calculated within each individual prior to box plot visualisation, in order to give each participant the same weight. The significant differences are indicated by *(p <.05) and **(p <.01).
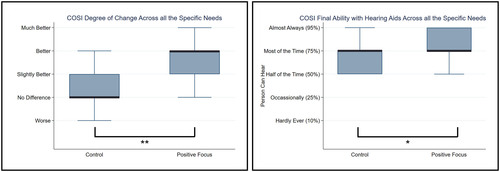
Table 4. Correlation analyses between the number of submitted positive experiences and hearing aid outcome ratings.
Table 5. Participant responses to “How did it go with the trial?” at the exit interview.