
Figures & data
Figure 1. (A) The active middle ear implant Vibrant Soundbridge VORP502/VORP503 placed to the round window. Optional round window couplers: (B) the spherical titanium round window coupler, (C) the silicone soft coupler and, (D) the custom-made Hannover Coupler (Images by courtesy of MED-EL).
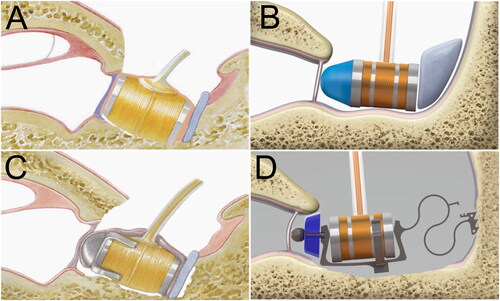
Table 1. Voltage input to the actuator at 0 dB direct threshold (data provided by courtesy of MEDEL).
Table 2. Maximum input voltage to the FMT provided by different implant/processor combinations (data provided by courtesy of MEDEL).
Figure 2. Unaided air and bone conduction thresholds in the investigated groups without coupler (NoC, N = 28), with the titanium round window coupler (RWC. N = 19), the soft coupler (SC, N = 10) and the custom-made Hannover Coupler (HC, N = 11).
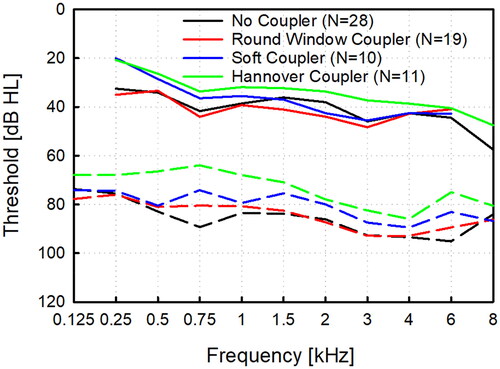
Figure 3. Maximum output hearing level for different coupling types to the round window and implant/processor combinations. The VORP502 implant coupled to the round window without coupler (A) and with the spherical coupler (B). Individual (blue) and mean MOHL (black) with the Amadé Hi/Samba Hi processor and examples with the Amadé LoLo (red). VORP503 implant coupled to the round window with the soft coupler (C) and with the Hannover Coupler (D). Individual (blue) and mean MOHL (black) with the Amadé Hi/Samba Hi processor and two examples with the Samba Lo (red).

Figure 4. Maximum output hearing level for round window coupling normalised for a hypothetical standard configuration of a VORP503 with a Amadé Hi/Samba Hi processor with different coupling modalities. (A) without a coupler, (B) with the spherical round window coupler, (C) with the soft coupler, (D) with the custom-made Hannover Coupler. Individual patient results are shown as thin blue lines and mean values and standard deviations as thick black lines.
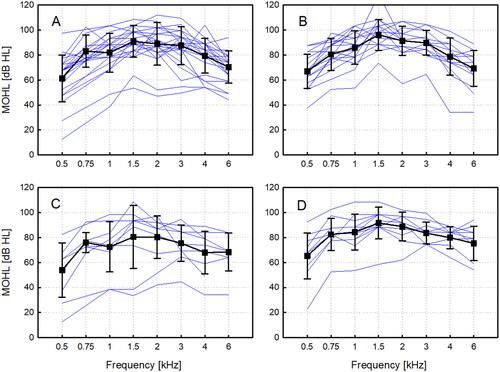
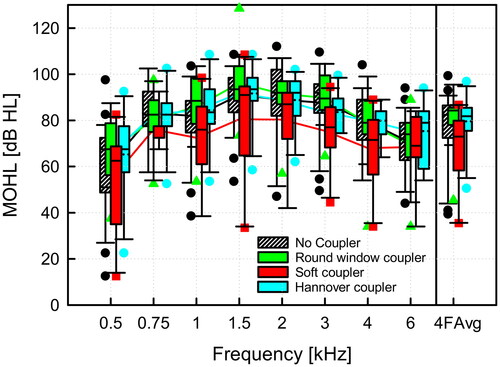
Figure 5. Comparison of normalised (VORP503, Amadé Hi/Samba Hi) MOHL for different methods of round window coupling. The four frequency average (4FAvg) was calculated as the average of maximum output at 0.5, 1, 2, 4 kHz. The boxplot for each group shows the median (solid line), the 25th and 75th percentiles (box) and the 5th and 95th percentile (whiskers) and outliers (symbols of corresponding color).
Data availability statement
The anonymized data used to support the findings of this study are available from the corresponding author upon request.