
Figures & data
Figure 1. The workflow of the map design modified from Tyner (Citation2014).
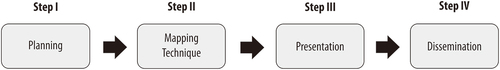
Table 1. The list of document sources that meet the screening criteria.
Figure 2. The sub-coding framework for the analysis of landslide maps design (modified from Tyner (Citation2014)).
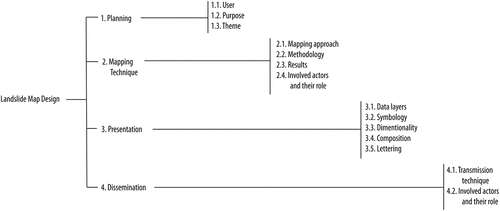
Table 2. The themes found in the landslides map for disaster risk communication.
Table 3. Mapping techniques used in each landslide map.
Table 4. The presentation designs for each landslide map.
Table 5. Dissemination techniques of each landslide map.
Supplemental material