
Figures & data
Figure 1. (a) Location of the study area in northern Scandinavia. (b) Location of the eight districts surveyed by Selander (Citation1950) and the Ålmajallojekna glacier (located south of the label VII). Dark green areas indicate spruce forests, light green indicates birch forests, grey indicates the area above the tree limit, blue indicates lakes.
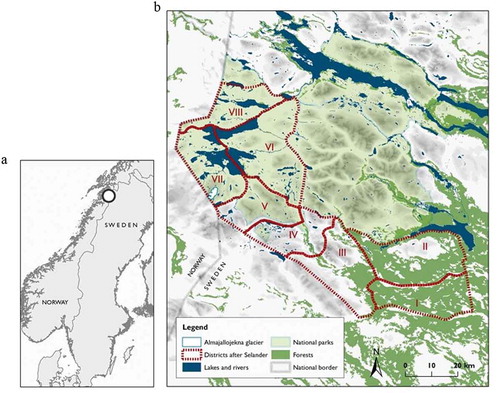
Figure 2. (a) The extent of the Ålmajallojekna glacier in 1898 (dark green), 1958 (green), 1980 (light green), and 2012 (white), as well as the twelve transects used for the plant survey undertaken during this study. The red crosses show the positions of the two temperature loggers. (b) Photo point XII in Westman (Citation1899) showing the eastern parts of Ålmajallojekna. The photographs were taken July 30, 1898 (left), and September 5, 2013 (right). (c) Photo point from Selander (Citation1950) (seen from Mt. Kasakpuolta) photographed July 26, 1946 (left), and September 5, 2013 (right). Selander (Citation1950) described the area in the photo as “Recently formed nunatak” (i.e., area completely devoid of phanerogam vegetation) and on the bare gravel in the foreground he found no phanerogam vegetation other than Saxifraga rivularis. Photos from 2013: Markus Franzén.
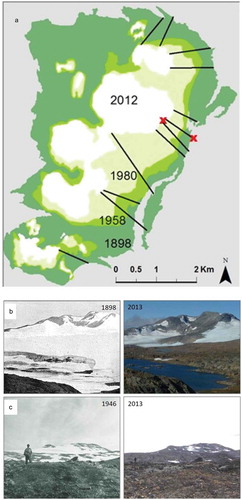
Figure 3. (a) Annual mean temperature from the temperature logger placed at the location of the 1898 glacier edge (−0.35°C) and at the glacier edge in 2011 (−1.31°C), indicating a temperature increase of 0.008°C per year (upper line). The mean annual temperature of the entire glacier area is based on extrapolated temperature data on grids for the six periods 1898–1958 (slope = 0.0019), 1898–1980 (slope = 0.0071), 1898–2012 (slope = 0.0107), 1958–1980 (slope = 0.0212), 1958–2012 (slope = 0.0203), and 1980–2012 (slope = 0.0197) (lower lines). The colder temperature from the yearly data according to the grids is because the grid extends across the entire glacier area, which is mainly covered by ice and includes higher altitudes. (b) Temperature anomalies calculated for each decade from 1900 to 2015 (1900 is based on extrapolated yearly mean temperature data covering the entire glacier area from 1900 to 1909, 1910 is based on data from 1910 to 1919, and so on).
Figure 4. Plant-species richness at the different age classes of the deglaciated terrain among the time periods 1898–1946 (slope = 0.04), 1898–2012 (slope = 1.04), 1958–2012 (slope = 1.64), and 1980–2012 (slope = 2.34). The year 1946 represents the date Selander (Citation1950) visited the glacier area and found only one plant species in the recently deglaciated terrain.
Table 1. The final best-fitting generalized linear model (lowest AIC) for the relationship between plants occurring on the recently established terrain or only outside (in the species pool) and the traits abundance, seed weight, and taxonomic family. For differences between each family, see Figure S6: df = 252, N = 264, R2 = 0.45; AIC = 204.5.
Table 2. Results from the best-fitting model analyzing the plants that only occur inside the recently deglaciated terrain and whether traits determine the ability to occupy younger terrain. Soil moisture and life form were linked to the ability to occupy younger terrain: df = 74, N = 78, R2 = 0.12; AIC = 201.1.