Figures & data
Figure 1. Map of the study area and sampling points. The map on the left shows the location of the study area in Greenland. The map in the middle is a general view of the study area including the location of the samples studied here and the location of a deep borehole, GAP04, drilled within the GAP project (Harper et al. Citation2016). The map on the right is an enlargement of the area with the position of the sampling points. The samples taken at each sampling point are listed in Tables S1 and S2 (supplemental material).
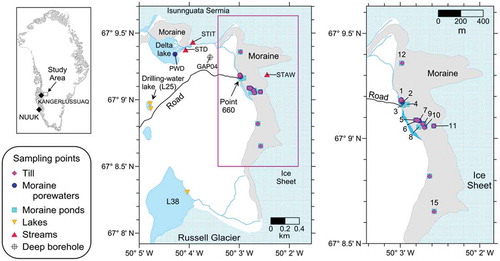
Figure 2. (a), (b) SEM images of biotite with different weathering stages and (c), (d) pyrite with outer rims of iron oxyhydroxides in a different degree of alteration visible in the pyrite grains with exposed surfaces. (a) TS1016: nonweathered biotite grain with a potassium content of 4.24 atom-%. (b) TS1016: biotite grain affected by weathering with a mean potassium content of 0.69 atom-% (maximum 2.29 atom-%). Bt = biotite, Pl = plagioclase, Am = amphibole. (c) TS1016: pyrite, FeS2 (Py), with an oxidized outer rim that contains 4.49 atom-% S, 0.33 atom-% Ca, 28.41 atom-% Fe, 2.42 atom-% Si, 0.36 atom-% Al, and 64.00 atom-% O, denoted FeOOH in the figure. (d) TS0516: pyrite crystal with a thin alteration rim with oxidized iron (FeOOH).
Figure 3. Piper diagram in the moraine porewaters and ponds, stream ST01, and lakes L25 and L38 sampled in this study. Also included for comparison: sandur porewaters and samples from the Watson River (Deuerling et al. Citation2018); basal (subglacial) meltwaters sampled through boreholes and Isunnguata Sermia outlet samples (Graly et al. Citation2014); and deep borehole groundwaters (Henkemans Citation2016).
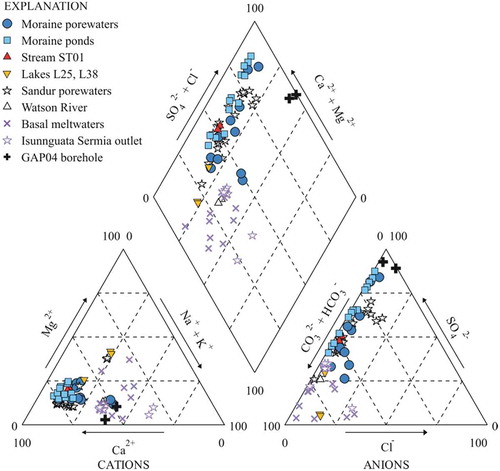
Figure 4. Plot of δ2HVSMOW vs. δ18OVSMOW for the water samples collected in this work. For comparison, the figure also includes basal ice samples from Yde et al. (Citation2010). The local meteoric water line (LMWL) is that proposed by Linhoff (Citation2016) from rain and snow data at the Leverett base camp.
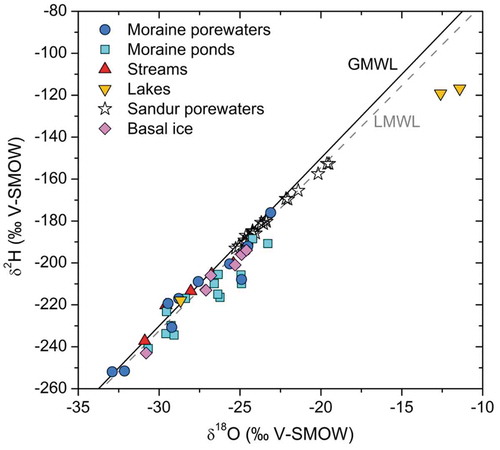
Figure 5. Scatterplot of Ca+Mg (μeq/L) vs. HCO3− +SO42− (μeq/L) for the waters analyzed in this study and for the sandur porewaters reported in Deuerling et al. (Citation2018).
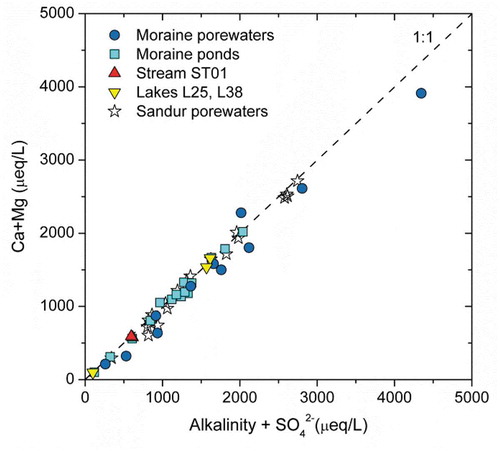
Table 1. Chemical weathering reactions.
Figure 6. Scatterplots of (left) Ca vs. SO42− and (right) Ca+Mg vs. SO42− for the waters in this study and the sandur porewaters reported in Deuerling et al. (Citation2018). The results obtained from the leaching experiments over time are also shown for comparison.
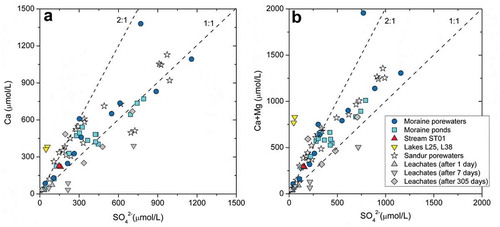
Figure 7. (Left) δ18OSO4 vs. δ18OH2O for the moraine waters. (Right) δ18OSO4 vs. δ34SSO4 for the moraine waters (Table S9 in the supplemental material) and for the laboratory leachates from the till after 7 days (see Table S8 in the supplemental material). Both diagrams also show data for the deep groundwaters sampled in the GAP04 borehole (Harper et al. Citation2016; Henkemans Citation2016), as well as the range of values for the pyrite and gypsum found abundantly as fracture filling minerals in the bedrock of the area (Henkemans et al. Citation2018).
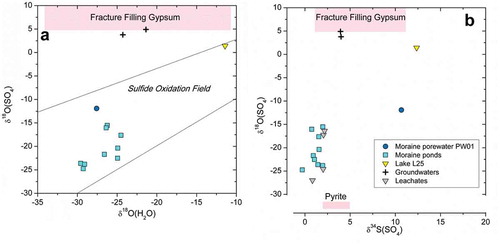
Figure 8. (a) Ca+Mg vs. alkalinity and (b) “corrected” contents of Ca+Mg vs. alkalinity. The plots show data for the water samples collected in this study as well as data for the sandur porewaters reported in Deuerling et al. (Citation2018).
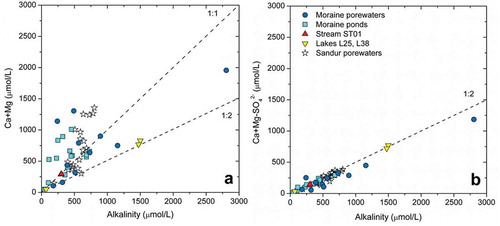
Figure 9. Concentrations of Ca vs. Sr for the waters in this study and the sandur porewaters from Deuerling et al. (Citation2018). Regional silicate end-member (green dashed line, Ca/Sr = 0.18) and carbonate end-member (blue dash-dotted line, Ca/Sr = 0.88) are also included Deuerling et al. (Citation2018).
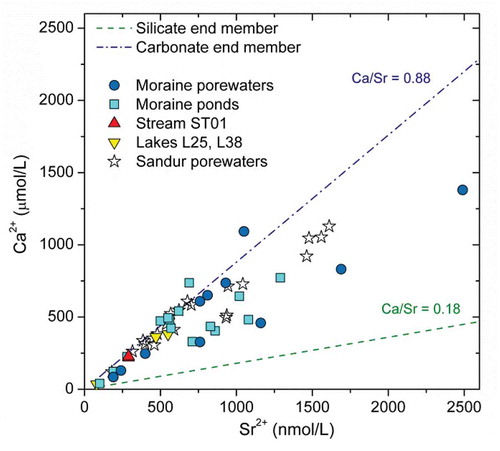
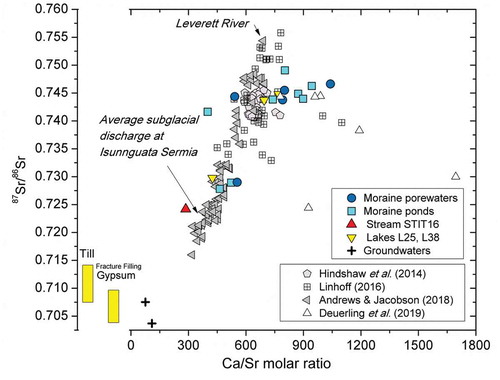
Figure 10. Strontium isotope data vs. Ca/Sr molar ratio for the water samples of this study compared with the range of strontium isotopes values for the till (this study) and for the gypsum found as fracture fillings in the underlying deep bedrock (Henkemans Citation2016). The figure also shows the data from Deuerling et al. (Citation2019) for the Watson River and the rivers discharging the Russell and Leverett Glaciers (Hindshaw et al. Citation2014; Linhoff Citation2016; Andrews and Jacobson Citation2018) at distances ranging from 2 km to about 30 km southwest of our study site.