Figures & data
Figure 1. Location of the three regions sampled in August 2018: (a) Clearwater Lake, (b) Boniface River, and (c) Payne Lake in Nunavik, Québec, Canada.
Figure 2. Position of the three linear surveys conducted near and underneath each of the seventy-five Betula glandulosa individuals sampled in Nunavik, Québec, Canada. Sampling was carried out on 40-cm-long linear surveys and separated from the other surveys by 40 cm. The end of the inner edge survey was aligned with the shrub edge so that it was completely under the shrub canopy.
Table 1. AICc model selection table for the three response variables (lichen cover, species richness, and evenness) on a latitudinal gradient in Nunavik, Québec, Canada. Second column presents parameters included in the different models. Nested random effects station/site/shrubID were included in each model. Marginal coefficients of determination (R2) are shown to describe the tested models.
Table 2. Lichen species and total cover (cm) in open area, shrub edge, and shrub center linear surveys recorded around and underneath seventy-five Betula glandulosa individuals at Clearwater Lake, Boniface River, and Payne Lake in Nunavik, Québec, Canada. Cladonia sp. refers to primary thallus of Cladonia species that could not be identified to the species level.
Table 3. Model-averaged coefficients for survey position (shrub edge and shrub center), shrub canopy closure, and shrub height for response variables (lichen cover, species richness, and evenness) on a latitudinal gradient in Nunavik, Québec, Canada. Reference level is survey position open area. Model’s shrub characteristics and survey position were used to estimate coefficients, based on AICc results.
Figure 3. Model-averaged (a) lichen cover (as percentage of the ground total surface), (b) species richness, and (c) evenness (Shannon index) for the different survey positions. Means and 95 percent CI (Confidence Intervals) were computed by model averaging based on model selection. Sixty-five of the seventy-five Betula glandulosa individuals sampled in Nunavik, Québec, Canada, were considered for this analysis.
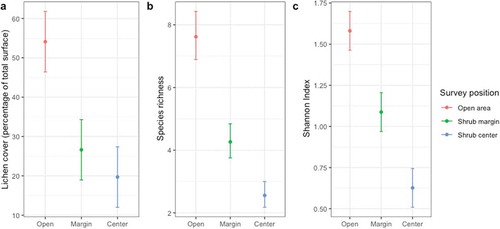
Table 4. Pearson’s phi coefficient of correlation of lichen species with survey positions near and underneath seventy-five Betula glandulosa individuals at Clearwater Lake, Boniface River, and Payne Lake in Nunavik, Québec, Canada. P-values were computed through 999 permutations. Preference column indicates that the species is significantly and positively associated with this survey position.
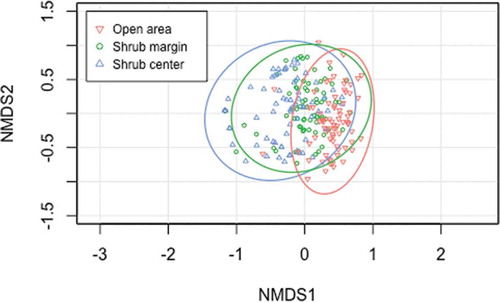
Figure 4. Ordination plot showing the first two of the three axes of a non-metric multidimensional scaling (stress = 0.157) based on dissimilarity matrices computed with adjusted Bray-Curtis index on the 225 surveys conducted near and underneath seventy-five Betula glandulosa individuals in Nunavik, Québec, Canada. Stress is of 0.157.