
Figures & data
Figure 1. Features of the Pipers Creek catchment and location relative to the MDB
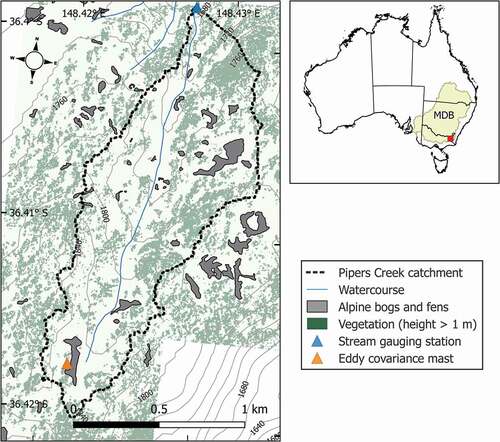
Figure 2. (a) Mean monthly precipitation, with ranges measured over the study period. (b) Mean daily air temperature at the area-weighted mean catchment elevation (1,783 m a.s.l.), with the seven-day moving mean (black). (c) Mean monthly inflows, with ranges measured over the study period. (d) Normalized cumulative inflows for water years in the study period (2006–2007 to 2017–2018), with the mean (black). Identified hydrological seasons based on streamflow are moderate flow winter season (1), high-flow snowmelt season (2), drying season (3), and low-flow season (4)
Table 1. Seasonal variations in catchment inflows and contributions to total water year inflows
Table 2. Regression coefficients for water year inflows against seasonal metrics
Figure 3. Proportional contributions to inflows by season, as a function of total water year (WY) inflows
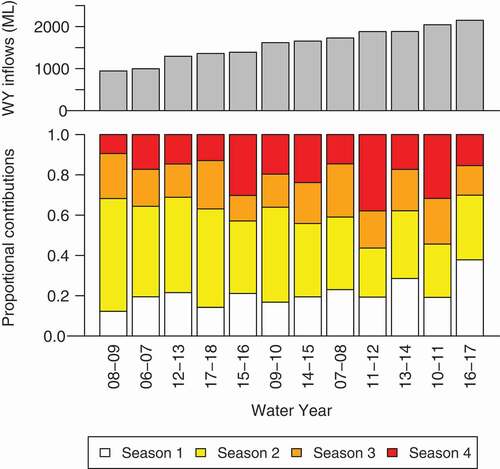
Figure 4. Time series of seasonal water balance terms
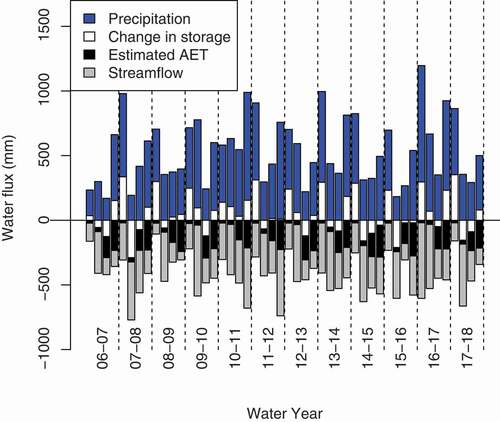
Table 3. Regression coefficients for water year runoff efficiency against seasonal metrics
Figure 5. Relationship between observed water year inflows and precipitation. The dashed line shows the mean annual water year runoff efficiency of 63 percent. Adjusted R2 = 0.848, p < .01

Figure 6. Catchment runoff coefficients for the snow-affected period (seasons 1–3) plotted against metrics related to water balance inputs
Figure 7. Comparison of normalized cumulative inflows at Pipers Creek and the Snowy River above Guthega for water years in the study period (2006–2017). Also shown is the Snowy River over an extended period of time
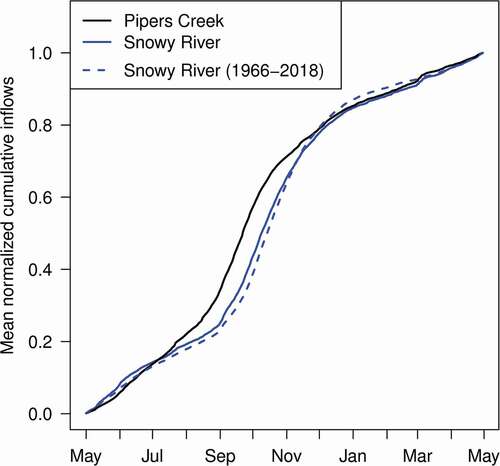
Table 4. Seasonal inflows as a proportion of the mean during the three wettest and three driest years