
Figures & data
Table 1. Description of the five alpine study sites
Table 2. Mean day of year of snowmelt and mean duration of snow cover (number of days), comprising data from years 2017–2020. FU = Furka, OB = Oberettes, UN = Untersulzbachtal, IN = Innergschlöss, S = Seebachtal
Table 3. Descriptive means (SDs) of soil parameters for each site and section
Figure 1. Mean abundances (individuals per square meter, in log scale) of (a) collembolans and (b) oribatid mites within each research site. Different letters above box plots indicate significant differences in abundances between sites. FU = Furka, OB = Oberettes, UN = Untersulzbachtal, IN = Innergschlöss, S = Seebachtal.
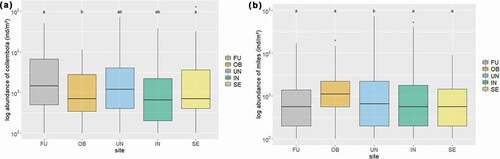
Figure 2. Shannon-Weaver index for microarthropod diversity within each research site. Different letters above boxplots indicate significant differences in microarthropod diversity between sites. FU = Furka, OB = Oberettes, UN = Untersulzbachtal, IN = Innergschlöss, S = Seebachtal.
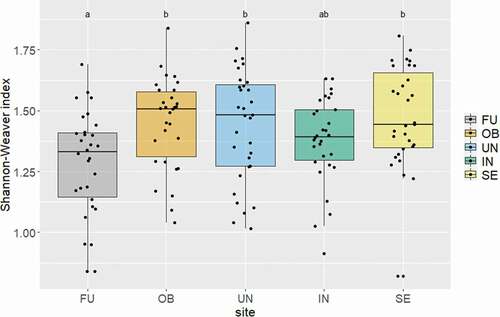
Figure 3. Mean abundances of generalist and specialist collembolans within each site. Asterisks indicate significant differences in abundances of generalists and specialists within a site. FU = Furka, OB = Oberettes, UN = Untersulzbachtal, IN = Innergschlöss, S = Seebachtal.
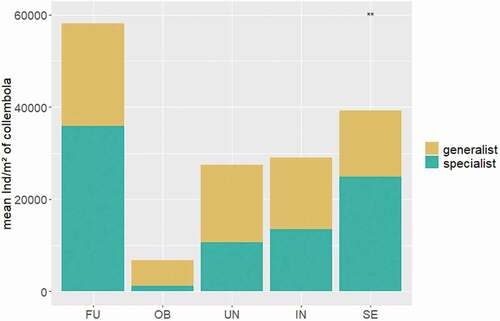
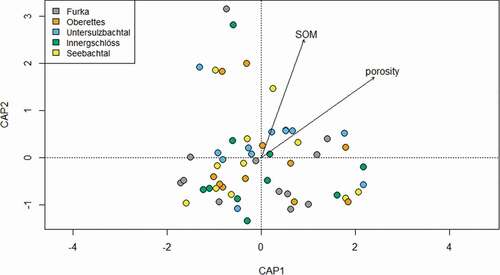
Figure 4. Constrained NMDS analysis of microarthropods.