Figures & data
Figure 1. Location of the study area. (A) Location map of Morocco (inset) showing the Atlas Mountains chain and the study area (red box). (B) Study area map of the Marrakech High Atlas showing the location of LMI TREMA automatic weather stations. (C) Elevation profile (swath shown in B) for the LMI TREMA stations used in this study (min/max elevation shown as gray shaded area).
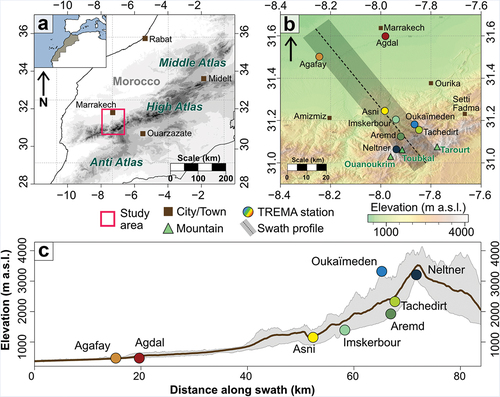
Table 1. LMI TREMA weather stations (arranged by altitude); location, site position, and monitoring equipment
Table 2. Monthly and annual lapse rates for the Marrakech High Atlas (°C km−1) for mean, mean minimum, and mean maximum temperature calculated for the study period: 1 January 2008 to 31 December 2018
Figure 2. Results of temperature lapse rate analysis for the Marrakech High Atlas TREMA stations. (A) Mean annual temperature versus elevation for the LMI TREMA stations, showing mean (black line, circles), minimum (blue line, inverted triangles), and maximum (red line, triangles), calculated from daily data for the study period 2008 to 2018. Shaded area shows the 95 percent confidence intervals for the all-inputs regression model, and the dashed lines show the LOOCV regression models used to calculate the lapse rate uncertainty range. (B) Box plots showing the lapse rates calculated from all regression models for each temperature variable (mean, minimum, maximum).
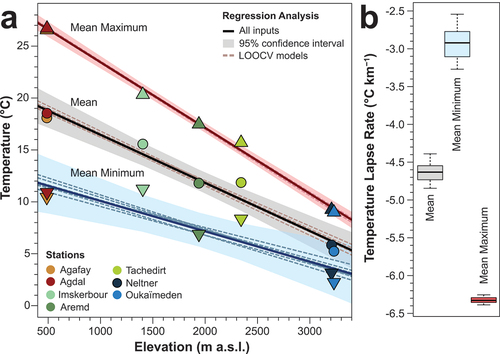
Figure 3. Box plots showing monthly temperature lapse rates calculated from all regression models for (A) mean temperature, (B) mean minimum temperature, and (C) mean maximum temperature. Monthly temperature means were calculated from daily data for the study period 2008 to 2018.
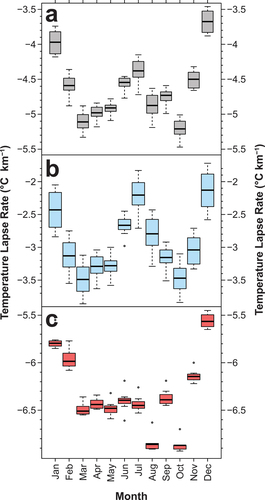
Figure 4. Half-hourly temperature analysis for the Marrakech High Atlas TREMA stations. (A) Heat map showing half-hourly mean temperature lapse rates for different periods (monthly, seasonal, and annual). Darker reds indicate steeper lapse rates, and lighter yellows indicate shallower lapse rates. (B) Mean annual half-hourly temperatures at each LMI TREMA station.
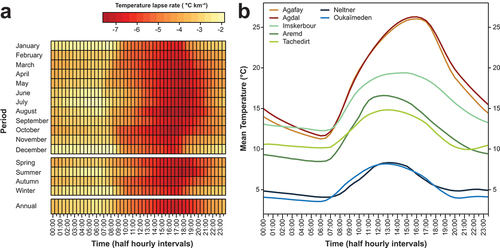
Figure 5. Analysis of humidity data for the Marrakech High Atlas TREMA stations. (A) Mean monthly relative humidity at each LMI TREMA station (solid lines) and mean monthly temperature lapse rates (black dashed line; shaded area shows uncertainty). (B) Mean annual half-hourly relative humidity at each LMI TREMA station (solid lines) and mean annual half-hourly temperature lapse rates (black dashed line; shaded area shows uncertainty).
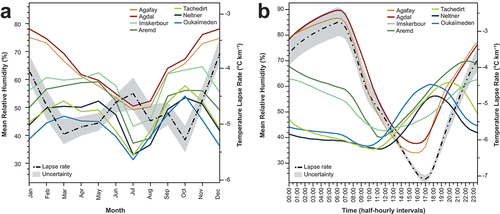
Figure 6. Precipitation gradient analysis for the Marrakech High Atlas TREMA stations. (A) Mean annual precipitation versus elevation for the LMI TREMA stations (excluding Neltner). Black line shows the all-inputs regression with shaded area showing the 95 percent confidence interval. The dashed lines show the LOOCV regression models (used to calculate the gradient uncertainty range). (B) Box plots showing a comparison of precipitation gradients in the region. From left to right, the first shows precipitation gradients calculated from the LMI TREMA stations using rainfall only (excluding Neltner and Oukaïmeden). The second shows the LMI TREMA stations using rainfall and snowfall. The third shows a gradient calculated from historic rainfall data from the wider watershed area (see Methods), and the fourth shows gradients calculated from the M’Goun Massif in the northeast High Atlas.
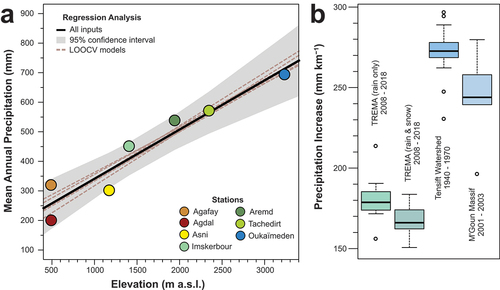
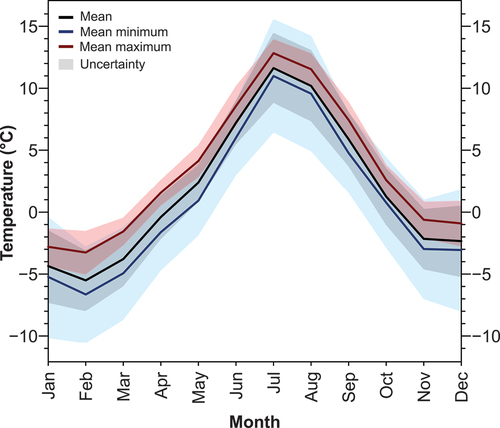
Figure 7. Extrapolated monthly temperature at Jbel Toubkal, based on the all-inputs regression models. Black line shows mean daily temperature for each month, blue line shows mean daily minimum temperature, and red line shows mean daily maximum temperature. Shaded area is the 95 percent confidence interval and indicates the uncertainty.