Figures & data
Figure 1. A conceptual diagram of the thermokarst detection algorithm (black), which is available as an R package, with the non-thermokarst landscape filters (light gray) and final processing steps (dark gray), neither of which are included in the R package. As part of the R package, (1) median elevation is calculated for each cell of a DTM using a moving circular neighborhood (we tested 15-, 25-, and 35-m radii individually and in combination), (2) microtopography is calculated by subtracting the median elevation from the DTM, and (3) elevation minima are classified as microtopography values below a threshold (we tested 0 cm, local elevation equal to the median elevation, and −5 cm, local elevation 5 cm below the median elevation). As part of the postprocessing not included in the R package, (1) steep slopes, deeply incised rivers, and non-thermokarst lakes were filtered out from the elevation minima; (2) combinations of thermokarst classifications were created to determine the best combination of neighborhood size and threshold value to detect different thermokarst sizes; and (3) the best classification was converted to vector format for analysis.
Table 1. Accuracy of the thermokarst detection algorithm when using the best combination of neighborhood sizes.
Figure 2. (a) The mean depth of thermokarst features (2017–2019) across the study extent (9 × 9 km black box). The EML watershed is outlined in black with the EC tower and approximate tower footprint shown as a point within a circle. The three gray points show the location of the three experimental blocks at CiPEHR. Colored squares indicate insets shown in (b)–(d). (b) The largest thermokarst pond we identified in one of the most heavily thermokarst affected areas within the study extent. In addition to naturally formed features, dogsled/ATV tracks are visible throughout the area. Twenty-six percent of the inset was classified as thermokarst. (c) Thaw ponds and water tracks that drain into EML surrounding the EC tower. Nineteen percent of the inset was classified as thermokarst. (d) Extensive small thermokarst pits on the terminal moraine east of EML (the greener, shrubby area), dogsled/ATV tracks, and thermokarst pits caused by soil warming at CiPEHR. Eleven percent of the inset was classified as thermokarst.
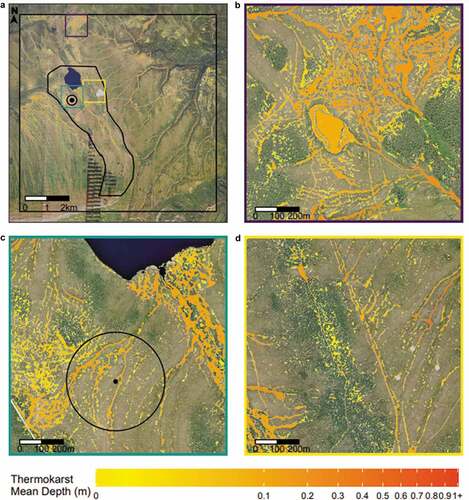
Figure 3. (a, b) Prevalence (percentage of features by count); (c), (d) percent cover (percent cover of thermokarst within that class relative to the entire study area − the sum of the classes is overall percent cover of 7 percent); (e), (f) percent volume; (g), (h) mean depth of thermokarst features by size and shape class. Labels in (a) and (b) indicate the number of features within each class.
Figure 4. (a) Thermokarst percent cover in 1° increments at the EC tower, (b) surface roughness in 1° increments at the EC tower, and (c) the relationship between percentage thermokarst cover and surface roughness at the EC tower, with the grayscale indicating the direction from which the measurement came (relative to the tower).
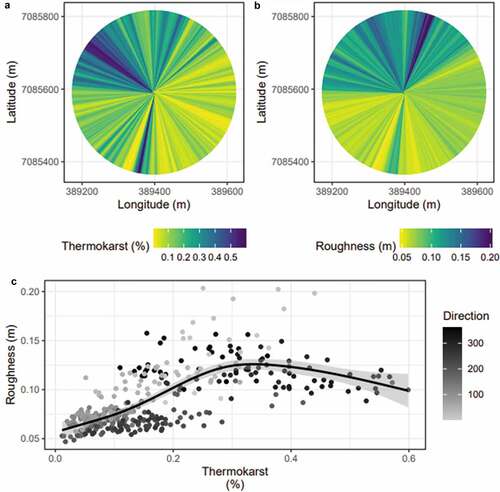
Figure 5. Coefficients for the linear regressions of GPP, NEE, and Reco by thermokarst percent cover. Positive intercepts indicate a source when no thermokarst is present and negative intercepts indicate a sink when no thermokarst is present. Positive slopes indicate that fluxes trend toward a larger source or smaller sink as thermokarst percent cover increases, depending on the sign of the flux. Negative slopes indicate that fluxes trend toward a smaller source or larger sink as thermokarst percent cover increases.
Figure 6. Coefficients for the linear regression of non-pulse CH4 fluxes by thermokarst percent cover and month. Positive values for intercepts indicate a source when no thermokarst is present and negative values for intercepts indicate a sink when no thermokarst is present. Positive values for slopes indicate that fluxes trend toward a larger source or smaller sink as thermokarst percent cover increases, depending on the sign of the flux. Negative values for slopes indicate that fluxes trend toward a smaller source or larger sink as thermokarst percent cover increases.