
Figures & data
Figure 1. Nutrient addition gradient study with simulated herbivory experimental design in three blocks, each containing four 5 × 20 m fertilization plots (CT, F2, F5, and F10). Each fertilization plot has two no-herbivory (NH), two pulse (PU), and two press (PR) individual tussocks.
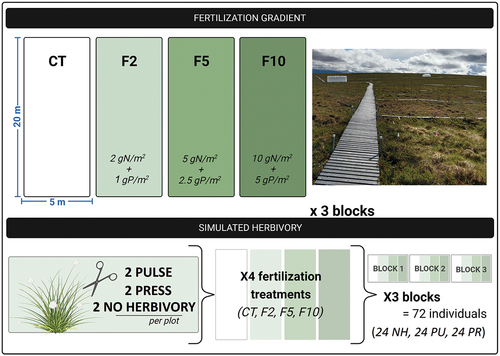
Figure 2. Mean (n = 3) relative cover of growth forms/species among years (2008–2021) and fertilization treatments (see for nutrient levels). Relative cover was not measured in 2009, and F2 treatments were not sampled in 2010 and 2011.
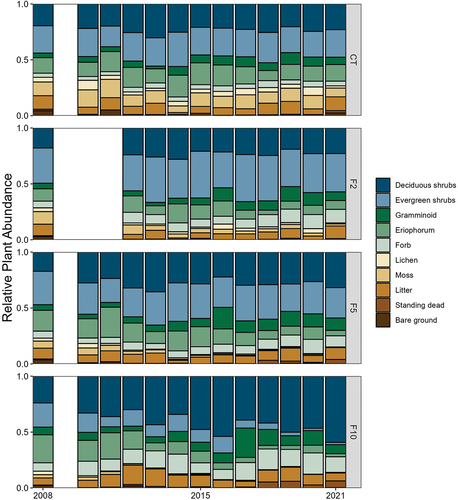
Table 1. Mean (n = 3; ± SD) species richness and Shannon diversity index per 1 m2 by fertilization level (see for treatment abbreviations) for the years 2008 and 2021. Superscript letters indicate means were significantly different within year.
Figure 3. Correlation between deciduous shrub and Eriophorum relative cover in each fertilization treatment. Each point represents the average for one block (n = 8 quadrats within block) for 3 points per treatment per year (2008–2021). Confidence interval around regression line is SE.
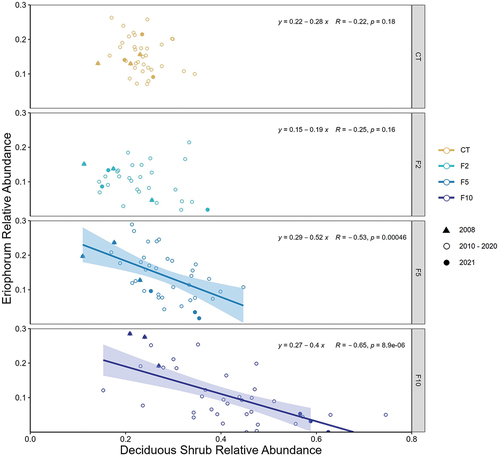
Figure 4. Mean (± SD, n = 3 except in F2 n = 2) Eriophorum tiller heights (cm) among simulated herbivory and fertilization treatments (see for treatment abbreviations) over four growing seasons (2018–2021). Note that tiller heights were only measured once in 2020 due to COVID-19 restrictions.
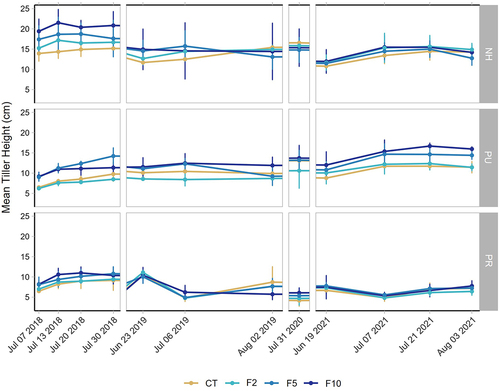
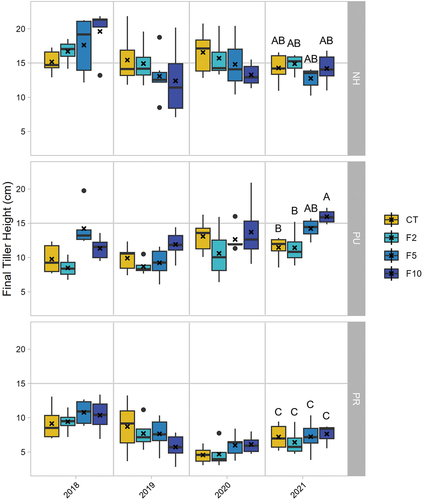
Figure 5. Final tiller heights (n = 3 except n = 2 in F2) among simulated herbivory and fertilization treatments for four growing seasons (2018–2021; treatment abbreviations in ). Xs indicate means; letters indicate significant differences among the means caused by a significant interaction between herbivory and fertilization in 2021.
Supplemental Material
Download Zip (1.2 MB)Data availability statement
The data that support the findings of this study are openly available in the Arctic Long-Term Ecological Research Data Catalog at https://arc-lter.ecosystems.mbl.edu/arctic-data-catalog.