
Figures & data
Figure 1. Relative interdisciplinary research integration.
Table 1. Summary of research questions, data, and methods used for analyses.
Figure 2. Journal co-citation network based on articles in all public affairs journals.
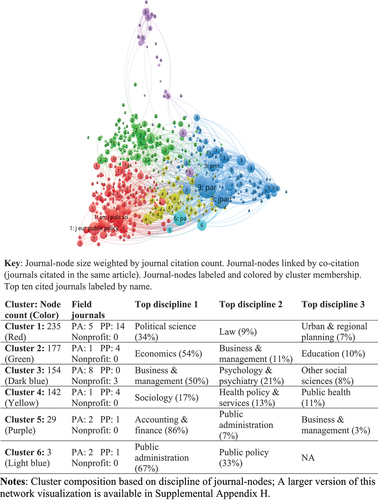
Figure 3. Journal co-citation network based on articles in PA journals.
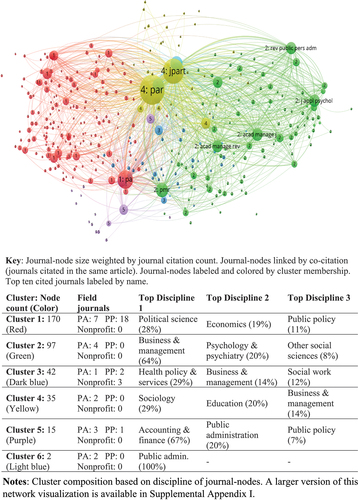
Figure 4. Journal co-citation network based on articles in PP journals.
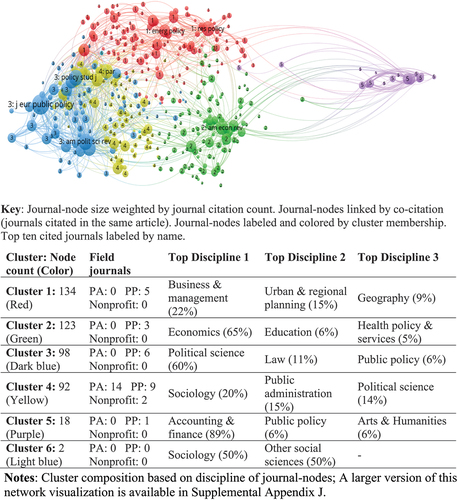
Figure 5. Journal co-citation network based on articles in nonprofit journals.
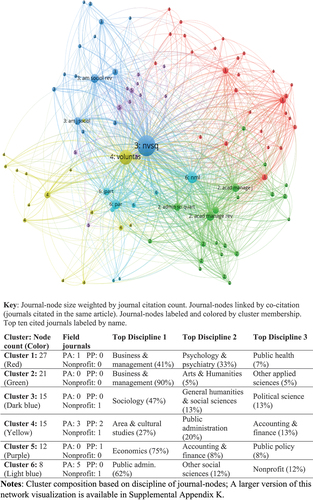
Figure 6. Percent of citations by discipline across articles published in PA, PP, and Nonprofit journals between 2009–2020.
Figure 7. Relative interdisciplinary knowledge integration by field from 2009–2020.
Table 2. Research categories at the PA/PP-Nonprofit nexus with article count, dominant field, and top four cited disciplines.
Table 3. Relative interdisciplinary knowledge integration by category in the PA/PP-Nonprofit nexus from 2009–2020.