Figures & data
Figure 1. Four forms of discourse coalition evolution (adapted from Metze & Dodge, Citation2016).
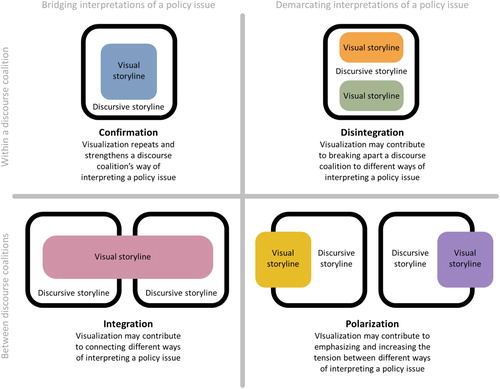
Figure 2. (a) NRDC photograph of David Headley igniting a flow of water, shot by director Joshua B. Pribanic of Public Herald Studios for the documentary Triple Divide, licensed under CC BY-NC-ND 2.0 , source: https://tripledividefilm.org. (b) Sierra Club photograph of a gas flare, shot by Karen Kasmauski, source: https://www.sierraclub.org/sierra/green-life/life-not-pretty-picture-fracking-epicenter-photography-people. (c) Discourse coalition and visualizations depicting flames in the NY controversy.
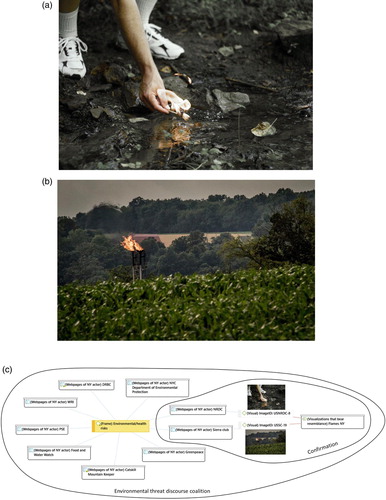
Figure 3. (a) CGS map showing the area earmarked as the shale gas sweet spot in Beaufort West, which is a chosen site for the Karoo Deep Drilling Program, source: the Council for Geoscience. (b) Discourse coalition and visualizations depicting maps with geological information in SA.
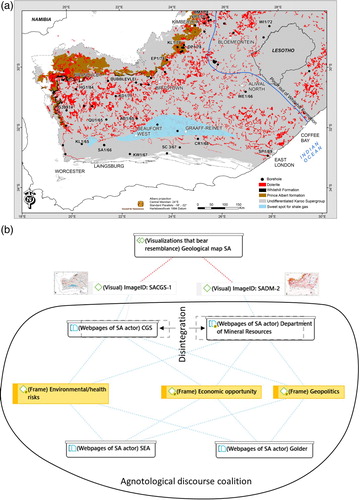
Figure 4. (a) Water pumping mill, source: Pxfuel. (b) Discourse coalitions and photographs of wind pumps in the South African controversy.
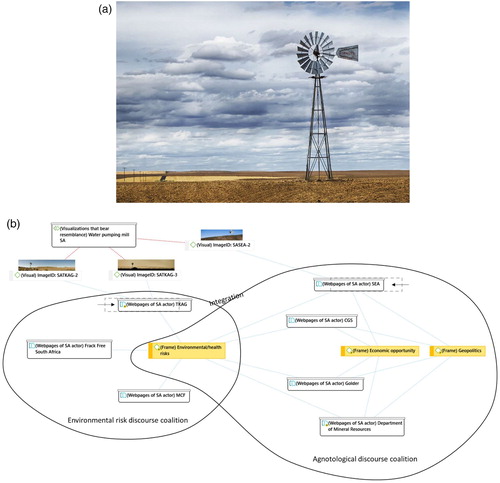
Figure 5. (a) NYSWRI's infographic of a drilling well, source: the United States Environmental Protection Agency. (b) Discourse coalitions and visualizations depicting hydraulic fracturing well in infographics in the NY controversy.
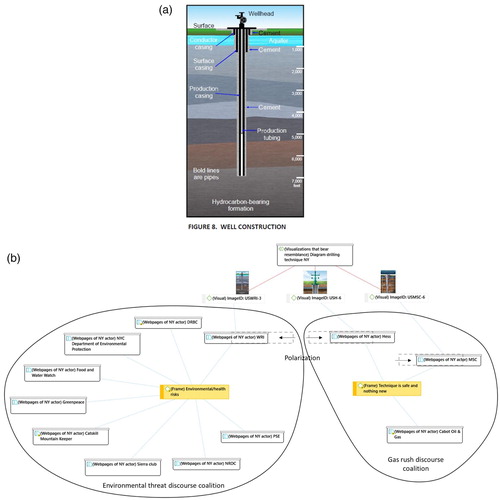
Figure 6. (a) Cooking stove flame, source: Pxfuel. (b) Discourse coalitions and photographs depicting flames in the Dutch controversy.
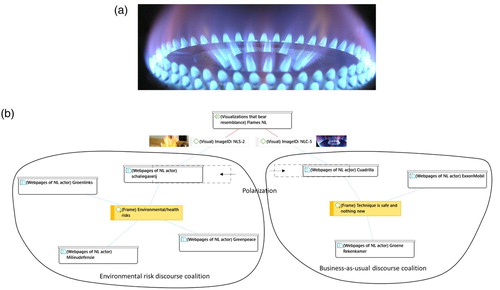
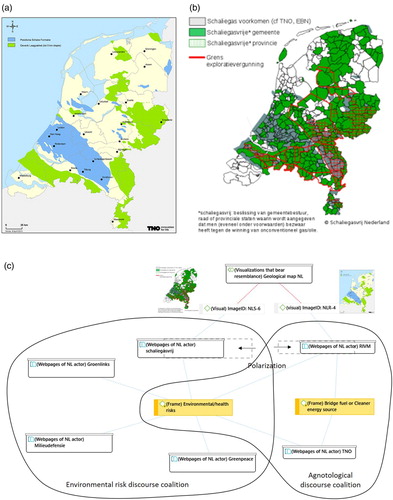
Figure 7. (a) RIVM map of shale gas reserves in the Netherlands, source: https://www.rivm.nl/schaliegas/schaliegas-en-winning (b) Schaliegasvrij map of shale gas reserves in the Netherlands and provinces and municipalities that have declared themselves shale gas free, source: https://www.schaliegasvrij.nl (c) Discourse coalitions and maps about shale gas in the Netherlands.