
Figures & data
Table 1. The nine identity statuses hypothesized by Waterman (Citation2015)
Table 2. Zero-order correlations between all variables as well as means and standard deviations of all variables at T1 (N = 1045) and T2 (N = 779)
Table 3. Criterion values for the different profile solutions at T1 (N = 1045) and T2 (N = 777)
Figure 1. Final latent profile solution at T1 (N = 1045), identical at T2 (N = 779)
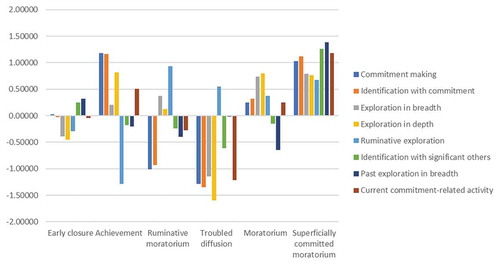
Table 4. MANOVAs for profiles and psychological well-being at T1 (N = 1294) and T2 (N = 1294) as well as change in means, when controlling for gender
Table 5. Latent transition probabilities between the profiles between T1 and T2
Table 6. Contingency table between identity domains and profiles with standardized residuals (N = 779)