Figures & data
Figure 1. The structural bi-factor model of the Dark Factor.
Note. Not all 70 items are depicted. Arrows represent loadings of all items on the general factor as well as the respective themes of D.
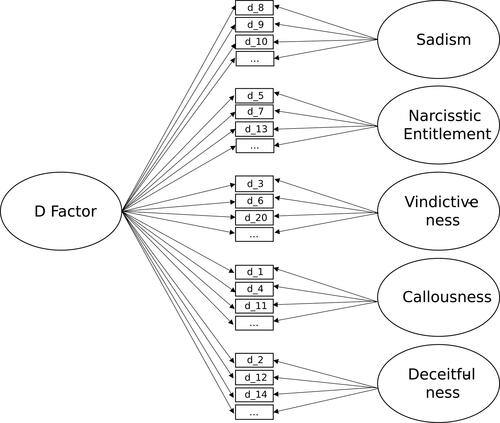
Table 1. Demographic variables of the sample.
Table 2. Standardized item loadings on D in the D70 and D16.
Table 3. Psychometric properties of the bifactor model of D70.
Table 4. Likelihood ratio tests for comparison of constrained and unconstrained GRM models.
Table 5. Fit indices for all SEM models.
Table 6. Reliability indices and latent bivariate correlations between constructs as indicators of convergent validity.
Table
Figure 2. Category Response Curve for Item d_64 in D70.
Note. Item d_64 states “Success is based on survival of the fittest; I am not concerned about the losers.” Item d_64 showed the highest α value (1.92) across D70. Probability curves show the most likely item response category (1 to 5) across the continuum of D. The ordered curves show distinct peaks, indicating good discrimination between individuals.
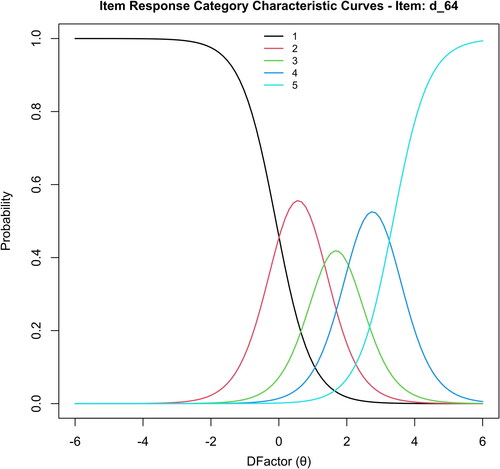
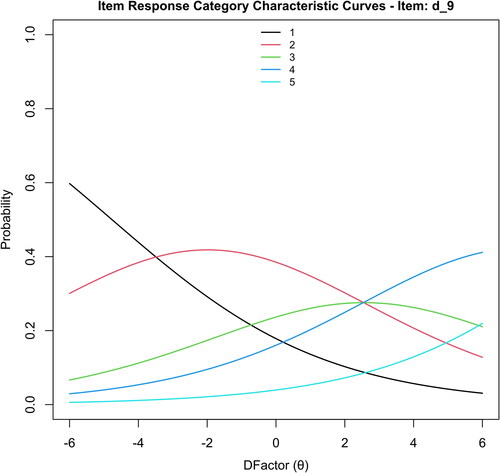
Figure 3. Category Response Curve for Item d_9 in D70.
Note. Item d_9 is reverse coded and states “It is not okay to spread rumors, not even to defend those you care about.” Item d_9 showed the lowest α value (0.32) across D70. Probability curves show the most likely item response category (1 to 5) across the continuum of D. The unordered curves without distinct peaks indicate poor discrimination between individuals.