
Figures & data
Table 1. Man-Years and Population by Non-Responding and Responding Organizations (N = 498).
Table 2. Survey Questions Used in the Measurement Models.
Table 3. Principal Component Analysis (N = 135).
Table 4. Assessment of Measurement Models (N = 135).
Table 5. Performance Information Use by Sector (N = 135).
Figure 1. Main results from the measurement models and the structural model (N = 135). PLS-PM results, 300 iterations, 5,000 bootstrap samples. SRMR = 0.06 (HI95 = 0.05, HI99 = 0.06). Highest HTMT = 0.81. *p < 0.05; **p < 0.01; ***p < 0.001, two-tailed p-values. Path-coefficients are standardized (beta) coefficients.
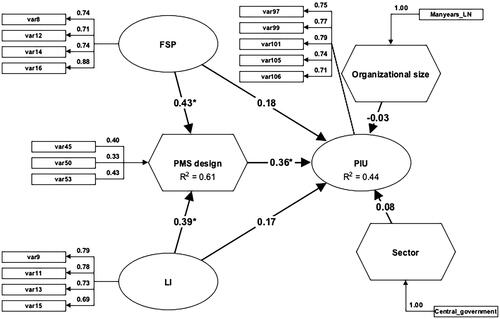
Table 6. Spearman Correlations (N = 135).
Table 7. Assessment of the Structural Model (N = 135).