Figures & data
Figure 1. PBMCs population before (A) and after (B) CD8+ depletion using anti-CD8+-coated magnetic beads. CD4+, CD8+, monocyte (Mono) and regulatory T cell (Treg) were gated to allow determination of population densities. Data from healthy donors (n = 3; experiment conducted in triplicate) were acquired using BD LSRFortessa and analyzed using FCS Express v.4. Following the depletion step, CD8+ cells were almost absent gating and did not interfere with Treg population density.
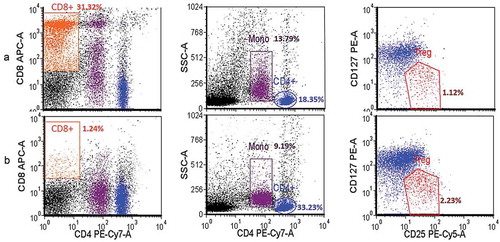
Figure 2. Gating strategy for sorting of CD4+-enriched regulatory (Treg) and autologous (Tconv) T cells. Cells were sorted by BD FACSAria III and analyzed by FCS Express v. (a) Doublet discrimination initiated by dot-plot between FSC-H and FSC-A, followed by SSC-W and SSC-H, then FSC-W and FSC-H, and SSC-A and FSC-A for final discrimination. (b) CD4+ population gated by SSC-A and CD4 PE-Cy7-A, then Treg gated from CD4+ by CD127low-CD25high+ population. (c) Tconv population gated by CD4+ CD25-CD127+ population.
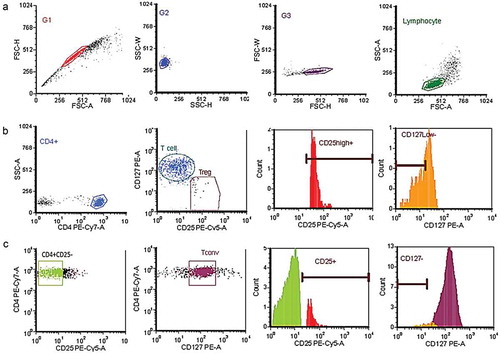
Figure 3. Intracellular Foxp3+ mensuration in short-term expanded Treg and pre-cultured Tconv. Expanded Tregs and pre-cultured Tconv were treated with Foxp3Alexafluor660 antibodies, then analyzed using a BD FACSAria III and FCS Express v.4. (a) Isotype test. (b) Foxp3 expression in Tregs after short-term expansion. (c) Foxp3 expression in Tconv after pre-cultured assay.
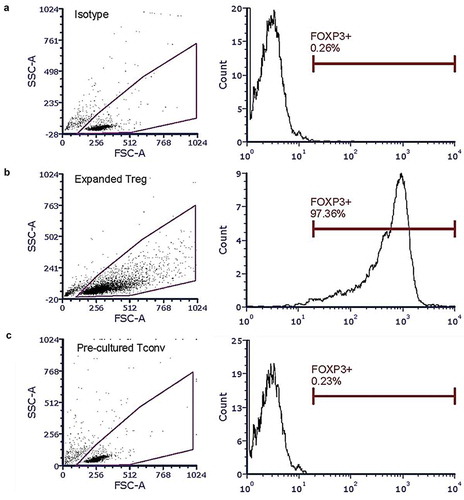
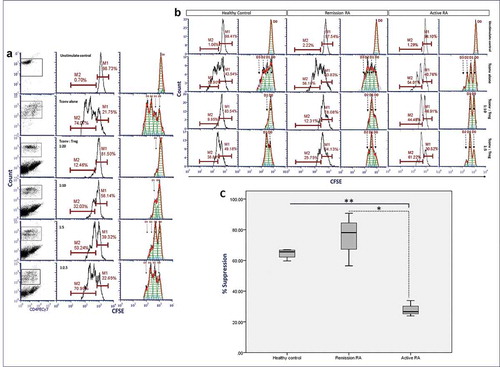
Figure 4. Co-culture suppression assay with short-term regulatory T cells (Treg) expansion and IL-2-pre-cultured autologous T cells (Tconvs) from healthy donors and patients with active rheumatoid arthritis (RA) and patients in remission which classified by ACR/EULAR 2010 or ACR 1987 criteria. IL-2-pre-cultured Tconv (1x10⁴ cells) were co-cultured with short-term expanded Tregs in culture medium supplemented with 500 IU/mL of human recombinant IL-2 and anti-CD3/28 beads for 72 h at 37ºC under an atmosphere of 5% CO2. Following co-culture, Tconvs were labeled with carboxyfluorescein succinimidyl ester (CSFE), counted in a Beckman Colter-FC500 and analyzed by FCS Express v.4. (a) Percent Tconv at different ratios of Tconv:Treg from a healthy donor. Left, center and right column: dot plot, histogram and histogram curve analysis, respectively, of CFSE-labeled Tconvs. (b) Percent Tconv at different ratios of Tconv:Treg from a healthy donor, a patient with active RA and an RA patient in remission donor. Left and right panel of each donor type: histogram and histogram curve analysis, respectively, of CFSE-labeled Tconvs. (c) Plot of percent suppression (in Tconvs:Treg ratio as 1:10) of healthy control donors (n = 4), patients with active RA (n = 3) and RA patients in remission (n = 3). Horizontal line, vertical line, and box represent group of patients and healthy control, percent suppression of Treg, box-plot with mean and range of the percent suppression, respectively. M1, original cell population; M2, proliferated cell population; D0, original cell division; D1, the first cell division; D2, the second cell division; D3, the third cell division; *p-value = 0.011, **p-value <0.0001; independent sample t-test.