Figures & data
Table 1. Description of the study sample.
Table 2. Scale Reliability Statistics and SEMs for GRS-S Scales by Grade.
Table 3. Bivariate Correlation between Gifted Rating Scales -S scores and CogAt5 scores.
Figure 1. Structural model and standardized loadings of GRS-S form.
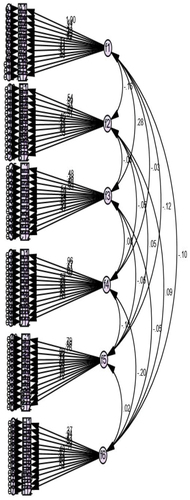
Table 4. Correlations demonstrating the loading of the scale’s factors.
Table 5. Conformity indicators and their levels of acceptance and values.
Table 6. Gender means, standard deviations, and results of MANOVA.
Table 7. Grade means, standard deviations, and results of MANOVA.
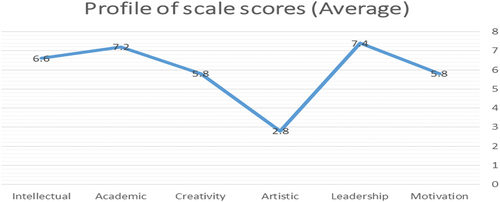
Figure 2. Profile of Saudi student on GRS-S scales.