
Figures & data
Figure 1. Trust face to face, online, online with AI.
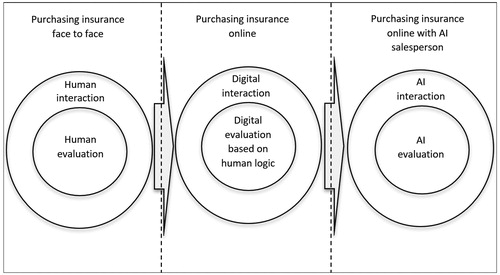
Figure 2. Research approach.
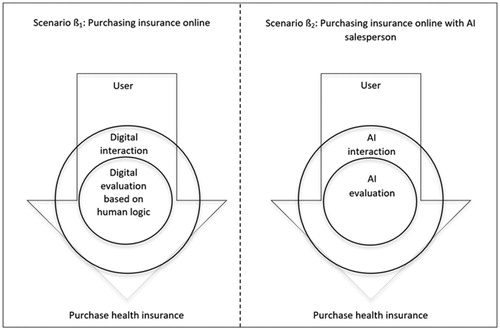
Figure 3. Research model and hypotheses.
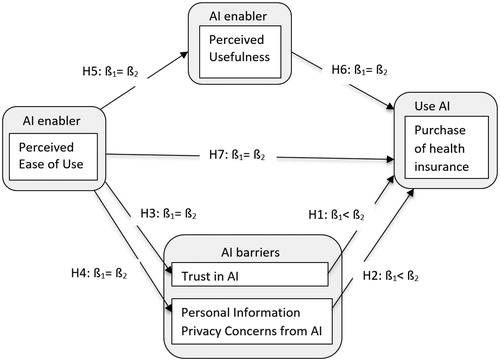
Table 1. Constructs and their indicators.
Table 2. Demographic information for both groups.
Table 3. Mean values for both groups.
Table 4. Results of the measurement model analysis.
Table 5. Test for measurement invariance.
Table 6. Multi-group comparison test results.