Figures & data
Fig. 1. Schematic illustration of the complex nuclear environment in an operating fusion tokamak. The diagram describes only some of the many complex phenomena that arise from the fusion reaction.
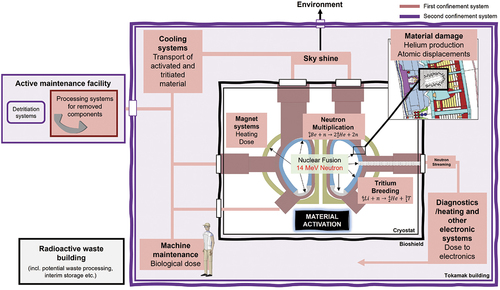
Fig. 2. Schematic overview of the conventional workflow including computational tools used for radiation transport analysis at the UKAEA.
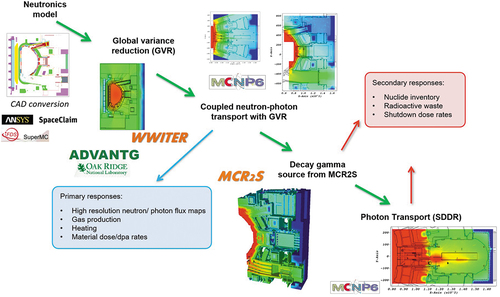
Fig. 3. List of SpaceClaim tools developed at the UKAEA using the SpaceClaim API directly accessible in the application ribbon.
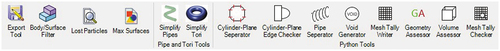
Fig. 4. User interface for the (a) pipe simplification tool together with an example of the (b) original and simplified pipe geometry.
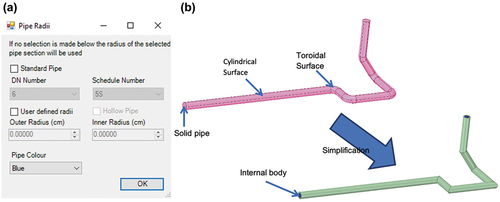
Fig. 5. Flowchart describing the workflow implemented for the N1S method for determining shutdown dose rates.
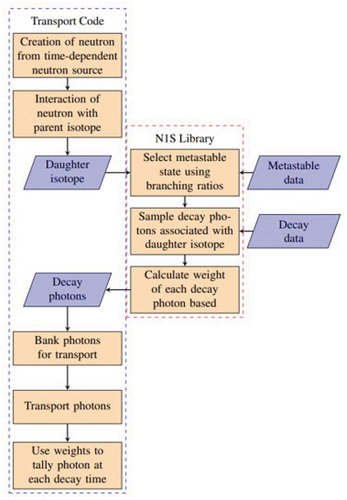
Fig. 6. Schematic overview of the workflow for nuclear analysis based on parameter-driven CAD models and CAD-based particle transport. The reactor CAD models in the illustration are output using the Paramak, one example of a framework developed at UKAEA for parametrically generating 3D CAD models.Citation36 CAD models © 2021 J. Shimwell et al. under an Open Access CC-BY license.
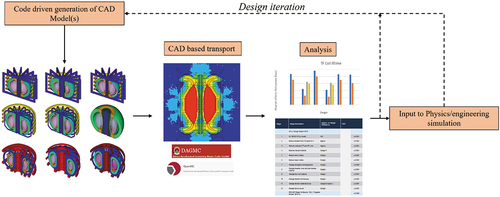
Fig. 7. Neutron flux map for the ITER port plug benchmark in OpenMC using an iterative scheme to generate global weight windows with increasing convergence across the entire mesh. The weight window boundaries are generated with the PS-GVR method.
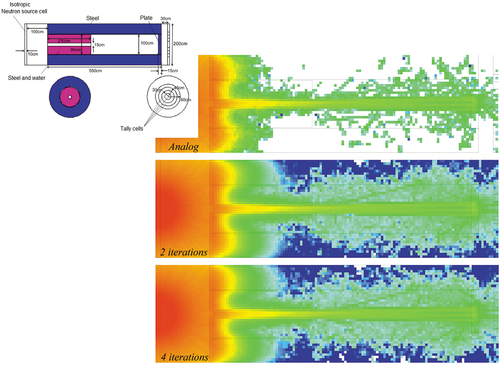
Fig. 8. Comparison of the MCNP-, Serpent-, and OpenMC-calculated neutron spectra in the closure plate of the ITER computational port plug. Each code uses an independent method of variance reduction (PS-GVR, ADVANTG, and response matrix method–based importance solver).
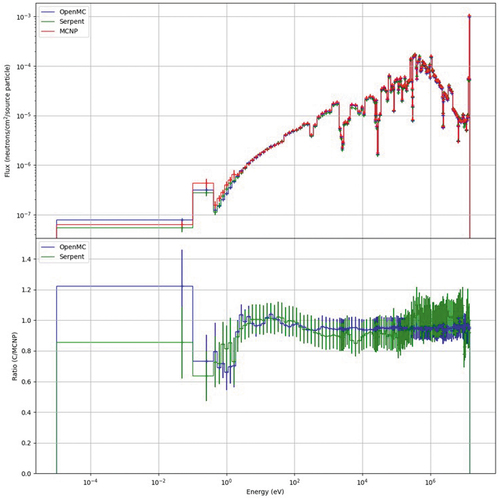
Fig. 9. (a) BEGe and data acquisition setup in the current onsite lab, (b) close-up view of the associated Compton suppression system with several sodium iodide detectors, (c) portable Trans-SPEC HPGe, and (d) diamond detector with data acquisition system.
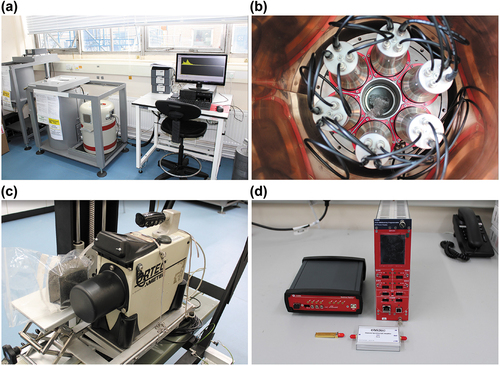
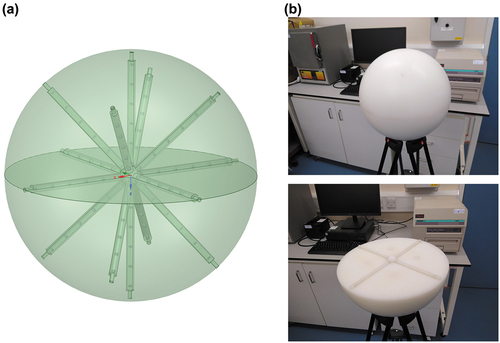
Fig. 10. (a) CAD model and (b) manufactured model of PNS detector with a 30-cm-radius sphere of HDPE, 14 arms each with six pairs of TLD-600 and TLD-700 badges equally spaced along each arm. In (b), the TLD reader can be seen in the background.