
Figures & data
Table 1. Urine, blood and inhalation biomarkers of tobacco smoke exposure.
Table 2. Summary of study demographics and FTCD scores by product use groups and overall.
Figure 1. Urine biomarkers – Day 5 percent change from Day −1.
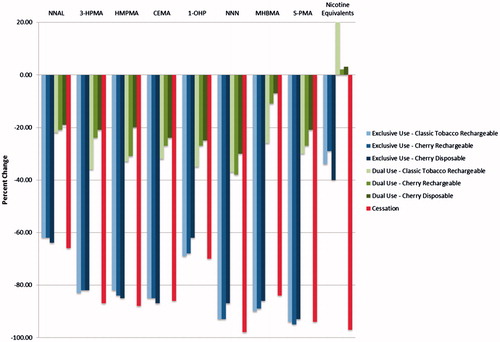
Figure 2. Blood biomarkers – Day 5 percent change from Day −1.
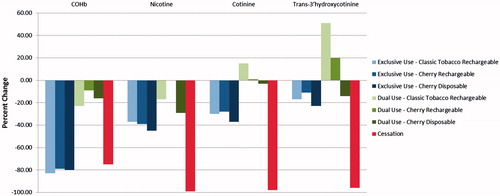
Table 3. Urine biomarker concentration summary and statistical comparisons.
Table 4. Blood biomarker concentration summary and statistical comparisons.
Table 5. Regression analyzes of the Day −1 to Day 5% change in the amount of urine biomarker amount excreted against the % change in cigarettes per day (CPD).
Table 6. Regression analyzes of nicotine equivalents excretion and Day −1 and Day 5 product use.
Table 7. Summary of regression analyzes of nicotine equivalents excretion and Day −1 and Day 5 product use.
Figure 3. Exhaled breath biomarkers – Day 5 percent change from Day −1.
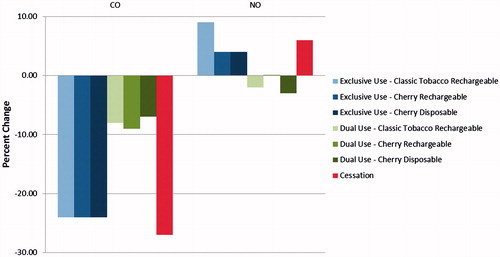
Table 8. Exhaled breath biomarker summary and statistical comparisons.