Figures & data
Figure 1. Correlation of PAI-1 mRNA expression with survival of patients with ovarian cancer. Microarray expression data for 2 probe sets representing SERPINE1 (A: 202627_s_at, and B: 202628_s_at) were used to generate Kaplan–Meier survival curves for high expression (defined as cancers with values above the median) or low expression for ovarian cancers. Data were analyzed using GraphPad Prism.
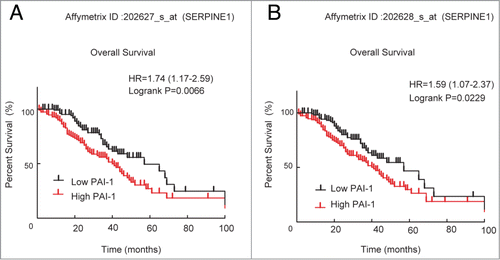
Figure 2. PAI-1 expression in ovarian cancer cell lines. ES-2, JHOC-9, JHOC-5, SKOV3, JHOC-7 and JHOC-8 cells were harvested and whole cell lysates were prepared. Proteins were subjected to immunoblot analysis with antibodies specific for PAI-1 and β-actin. Equal amounts of protein (10 μg) were loaded in each lane.
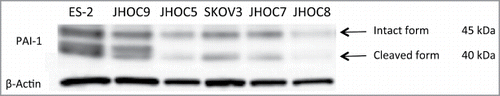
Figure 3. Effect of PAI-1 siRNA on cell viability, cell cycle distribution, and apoptosis in ovarian cancer ES-2 cells. ES-2 cells were transfected with 5 nM control siRNA (#1 and #2) or 5 nM PAI-1 siRNA (#1, #2 and #3) for up to 96 h. (A) After 72 h transfection, ES-2 cells were harvested and whole cell lysates were prepared. Proteins were subjected to immunoblot analysis with antibodies specific for PAI-1 and β-actin. Equal amounts of protein (5 μg) were loaded in each lane. (B) Cell viability was determined by CellTiter-Glo assay following transfection with siRNA for the indicated periods of time. Values are means ± SD. At 48 h post-transfection, the viability of ES-2 cells transfected with PAI-1 siRNA (#1, #2 and #3) was significantly decreased compared with that of control siRNA (#2) (P < 0.01 by Student t test for 2 variables). At 72 and 96 h post-transfection, the viability of ES-2 cells transfected with PAI-1 siRNA (#1, #2 and #3) was significantly decreased compared with cells transfected with control siRNA (#1 and #2). P < 0.01 at 72 h; P < 0.001 at 96 h by Student t test for 2 variables. (n = 8). (C) ES-2 cells were transfected with 5 nM control siRNA #1 or 5 nM PAI-1 siRNA #2 for 72 h. After fixation, cells were stained with PtdIns. Cell cycle distribution was determined by FACS with FlowJo analysis. Representative FACS results of cells transfected with control siRNA (upper left panel) or PAI-1 siRNA (upper right panel) are shown. Cell cycle distribution from 3 independent experiments. Values are means ± SEM. **P < 0.005 by Student t test for 2 variables. (D) ES-2 cells transfected with 5 nM control siRNA#1 (upper left panel) or 5 nM PAI-1 siRNA #2 (upper right panel) for 72 h. Cells were stained with FITC-conjugated Annexin V and PI, and FACS analysis was performed. Representative FACS results are shown. PI-negative and Annexin-V-positive cells from 3 experiments. Values are means ± SE. (E) ES-2 or JHOC-9 cells transfected with 5 nM control siRNA #2 or PAI-1 siRNAs (#1, #2 and #3) for 72 h were harvested and whole cell lysates were prepared. Proteins were subjected to immunoblot analysis with antibodies specific for cleaved PARP, intact PARP and β-actin. Equal amounts of protein (5 μg) were loaded in each lane. (F and G) ES-2 or JHOC-9 cells were transfected with the indicated siRNAs. After 72 h, activation of caspase 3/7 or caspase 8 was assessed by Caspase-Glo 3/7 or Caspase-Glo8, respectively. Values are means ± SE (n = 4). P values were determined by Student t test, control siRNA vs. PAI-1 siRNA. (H) ES-2 or JHOC-9 cells were transfected with the indicated siRNAs. After 72 h, cells were fixed and stained with cytochrome c antibody (green) and Hoechst33342 (blue). Imaging was performed by confocal microscopy. White allows show cells with cytochrome c released from mitochondria to cytoplasm.
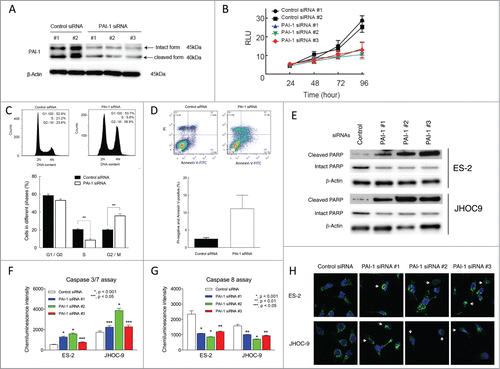
Table 1. IC50 values of TM5275 for cell viability of ovarian carcinoma cell lines.
Figure 4. Effects of TM5275 on cell viability, cell cycle distribution and apoptosis induction in ovarian clear cell adenocarcinoma cells. (A) Chemical structure of TM5275. (B) ES-2, JHOP-9, JHOC-5, SKOV3, JHOC-7 and JHOC-8 cells were treated with the indicated concentrations of TM5275 for 72 h. Cell viability was determined by CellTiter-Glo assay in 3 experiments. Values are means ± SD. IC50 in individual cell lines is shown in . (C) ES2 were treated with DMSO (control) or 100 μM TM5275 for the indicated periods. Cell growth was determined by CellTiter-Glo assay (n = 3). (D) After TM5275 treatment for 96 h, cell culture media of ES2 cells were harvested. Active PAI-1 amounts were determined by active human PAI-1 functional assay ELISA kit (n = 4). (E) ES-2 cells were treated with DMSO (upper left panel) or 100 μM TM5275 (upper right panel) for 24 h. After fixation, cells were stained with PI. Cell cycle distribution was determined by FACS with FlowJo analysis. Representative FACS results are shown. Cell cycle distribution from 3 independent experiments. Values are means ± SE. *P < 0.05 by Student t test for 2 variables (n = 3). (F) ES-2 cells were treated with DMSO (upper left panel) or 100 μM TM5275 (upper right panel) for 24 h. Cells were stained with FITC-conjugated Annexin V and PI, and FACS analysis was performed. Representative FACS results are shown. PI-negative and Annexin-V-positive cells from 3 experiments. Values are means ± SE. *P < 0.005 by Student t test for 2 variables (n = 3).
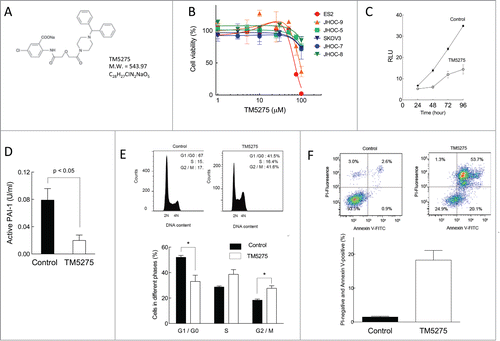
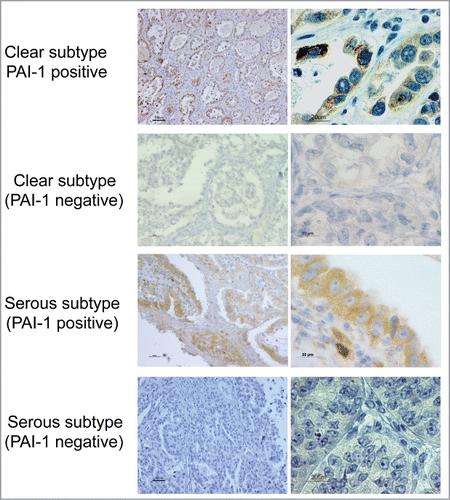
Table 2. The number of PAI-1-positive and -negative samples in individual histological subtypes of ovarian cancer. PAI-1-positive expression is significantly associated with clear cell subtype (P < 0.05 in χ2 test).
Figure 5. PAI-1 expression in different histological subtypes of human ovarian carcinoma. Cancer tissues were stained with PAI-1 antibody. Representative examples of PA1-1-positive and -negative immunostaining in tissues of ovarian clear cell and serous adenocarcinoma, respectively (original magnification: left panels, 200×; right panels, 1,000×). Scale bars represent 50 or 100 μm (left panels), and 20 μm (right panels).