1,181
Views
56
CrossRef citations to date
0
Altmetric
Research Papers

Plasma miR-183 predicts recurrence and prognosis in patients with colorectal cancer

, , , &
Pages 268-275 | Received 26 Jul 2014, Accepted 18 Dec 2014, Published online: 10 Mar 2015

Figures & data

Figure 1. The expression levels of miR-183 in primary colorectal cancer (CRC) tissues and CRC cell lines. (A) The expression levels of miR-183 were significantly higher in CRC tissues than in paired normal colorectal tissues (P <0.001; Wilcoxon t-test). (B) The expression levels of miR-183 were significantly higher in CRC cell lines than in the normal colon cell line FHC and normal colorectal tissues (P <0.001; Mann-Whitney U-test). RNU6B (U6) was used as an internal control.

Figure 1. The expression levels of miR-183 in primary colorectal cancer (CRC) tissues and CRC cell lines. (A) The expression levels of miR-183 were significantly higher in CRC tissues than in paired normal colorectal tissues (P <0.001; Wilcoxon t-test). (B) The expression levels of miR-183 were significantly higher in CRC cell lines than in the normal colon cell line FHC and normal colorectal tissues (P <0.001; Mann-Whitney U-test). RNU6B (U6) was used as an internal control.

Figure 2. The miR-183 expression levels in plasma simples. (A) The miR-183 expression levels in plasma were significantly higher in colorectal cancer (CRC) patients (n = 118 ) than in healthy controls (n = 61 ) (P < 0.0001; Mann-Whitney U-test). (B) The miR-183 expression levels in the postoperative samples were significantly lower than those in the preoperative samples (p = 0 .001; Wilcoxon t-test). In three cases, the plasma miR-183 expression levels were re-elevated when patients developed postoperative recurrence. RNU6B (U6) was used as an internal control.
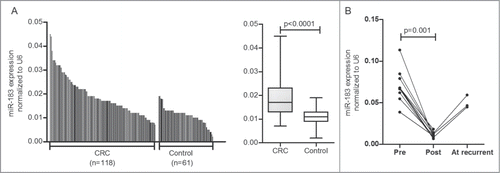
Figure 2. The miR-183 expression levels in plasma simples. (A) The miR-183 expression levels in plasma were significantly higher in colorectal cancer (CRC) patients (n = 118 ) than in healthy controls (n = 61 ) (P < 0.0001; Mann-Whitney U-test). (B) The miR-183 expression levels in the postoperative samples were significantly lower than those in the preoperative samples (p = 0 .001; Wilcoxon t-test). In three cases, the plasma miR-183 expression levels were re-elevated when patients developed postoperative recurrence. RNU6B (U6) was used as an internal control.

Figure 3. Comparison of the receiver operating characteristic (ROC) curves for miR-183 in the plasma and the conventional colorectal cancer biomarkers, carcinoembryonic antigen (CEA) and carbohydrate antigen 19–9 (CA19–9) in the serum.
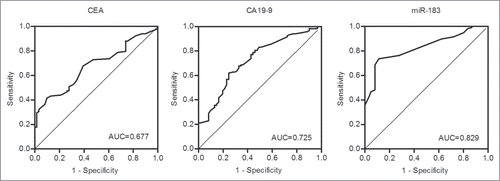
Figure 3. Comparison of the receiver operating characteristic (ROC) curves for miR-183 in the plasma and the conventional colorectal cancer biomarkers, carcinoembryonic antigen (CEA) and carbohydrate antigen 19–9 (CA19–9) in the serum.

Figure 4. Survival analysis of 118 colorectal cancer (CRC) patients grouped by their mean level of plasma miR-183. (A) The levels of plasma miR-183 in the high-expression and low-expression and controls groups. (B-C) Kaplan–Meier curves of 118 CRC patients showing the disease-free survival (DFS) and the overall survival (OS). The CRC patients with high miR-183 expression in the plasma displayed shorter DFS (P < 0.0001; log-rank test) and lower OS (p = 0 .0006; log-rank test).
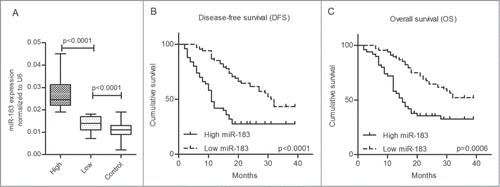
Figure 4. Survival analysis of 118 colorectal cancer (CRC) patients grouped by their mean level of plasma miR-183. (A) The levels of plasma miR-183 in the high-expression and low-expression and controls groups. (B-C) Kaplan–Meier curves of 118 CRC patients showing the disease-free survival (DFS) and the overall survival (OS). The CRC patients with high miR-183 expression in the plasma displayed shorter DFS (P < 0.0001; log-rank test) and lower OS (p = 0 .0006; log-rank test).

Table 1. The relationship between plasma miR-183 expression and the clinicopathological characteristics

Table 2. Univariate and multivariate analyses with regard to overall survival

Table 3. Univariate and multivariate analyses with regard to tumor recurrence

Figure 5. The miR-183 expression levels in hematocytes collected from 118 colorectal cancer (CRC) patients and 61 healthy controls. There was no significant difference in the miR-183 expression levels between CRC patients and healthy controls (p = 0 .1244; Mann-Whitney U-test). RNU6B (U6) was used as an internal control.
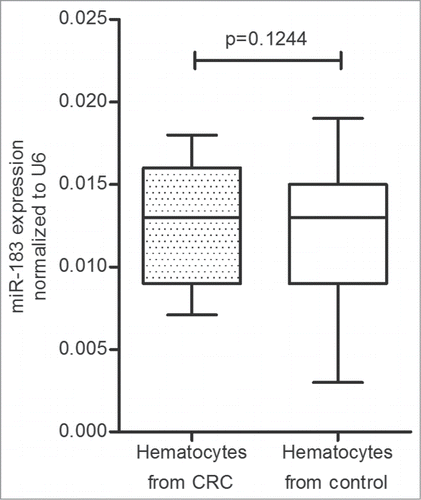
Figure 5. The miR-183 expression levels in hematocytes collected from 118 colorectal cancer (CRC) patients and 61 healthy controls. There was no significant difference in the miR-183 expression levels between CRC patients and healthy controls (p = 0 .1244; Mann-Whitney U-test). RNU6B (U6) was used as an internal control.

Reprints and Corporate Permissions

Please note: Selecting permissions does not provide access to the full text of the article, please see our help page How do I view content?

To request a reprint or corporate permissions for this article, please click on the relevant link below:

Academic Permissions

Please note: Selecting permissions does not provide access to the full text of the article, please see our help page How do I view content?

Obtain permissions instantly via Rightslink by clicking on the button below:

If you are unable to obtain permissions via Rightslink, please complete and submit this Permissions form. For more information, please visit our Permissions help page.