Figures & data
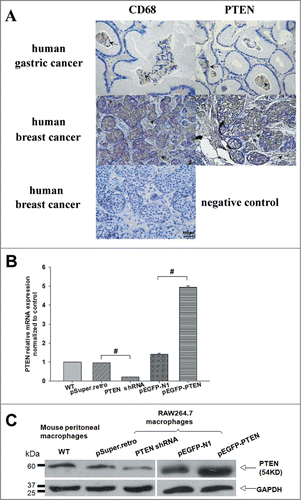
Figure 1. Tumor-associated macrophages (Mφ) differentially expressed PTEN in vivo and in vitro. (A) Distinct expression patterns of tumor-infiltrating CD68-positive and PTEN-positive cells in human tumor samples. Consecutive sections of gastric or breast carcinoma were used for immunohistochemical identification of CD68- positive and PTEN-positive cells. Positive cells were stained brown, nonspecific immunoglobulin was used as a negative control. (B, C) The level of PTEN in primary macrophages and RAW 264.7 cells transfected with shRNA and pEGFP specific for mouse PTEN or the negative control were analyzed by Q-PCR and WB, GAPDH was used as an internal control.

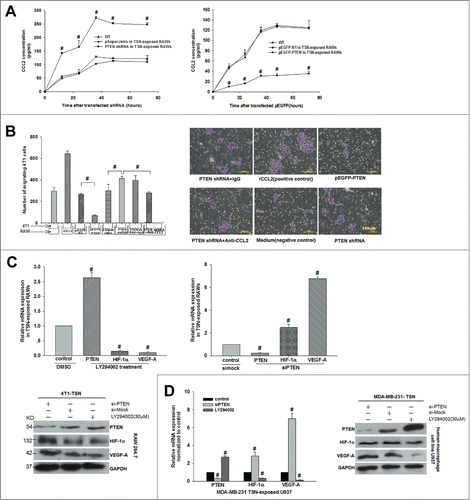
Figure 2. Interference of PTEN boosted CCL2 production and then promoted 4T1 tumor cells invasion and VEGF-A expression in vitro. (A) Production of CCL2 in TSN-exposed RAWs with shPTEN and pEGFP-PTEN was determined by ELISA. Supernatants were obtained for the indicated time periods, #P < 0.05 vs. control. (B) The 4T1 cells were added into the upper chamber and incubated for 24 h with different stimuli in culture medium. The migrated cells were quantified in 10 random fields at × 100 magnification. #P < 0.05. All data were representatives of at least 3 independent experiments. (C, D) mRNA and protein were extracted from TSN-exposed RAWs and U937 treated with siPTEN and LY294002, then validated the expression of PTEN, VEGF-A, and HIF-1α by Q-PCR and WB. Q-PCR and immunoblotting data were representatives of 3 separate experiments, #P < 0.05.

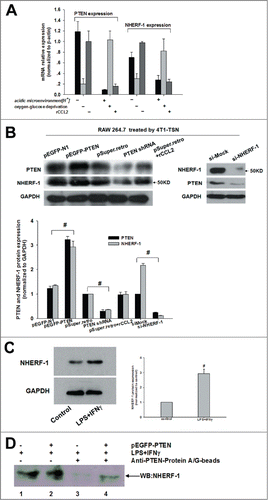
Figure 3. Association of PTEN with NHERF-1. (A, B) mRNA expression of NHERF-1 and PTEN in TSN-exposed RAWs with different treatment was detected by Q-PCR and WB was performed to detect the protein expression of NHERF-1 and PTEN. (C) TSN-exposed RAWs were stimulated with IFNγ and LPS or left in media for 16 h, lysed, and analyzed by western blot and then quantificated the increase expression of NHERF-1. (D) IP: IB was performed to determine the possible intracellular association between PTEN and NHERF-1. Lane1: NHERF-1 lysate; Lane2: NHERF-1 and PTEN lysate; Lane3: IP PTEN, IB NHERF-1 in NHERF-1 lysate; Lane4: IP PTEN, IB NHERF-1 in NHERF-1 and PTEN lysate. Q-PCR and immunoblotting data was representative of 3 separate experiments, #P < 0.05.

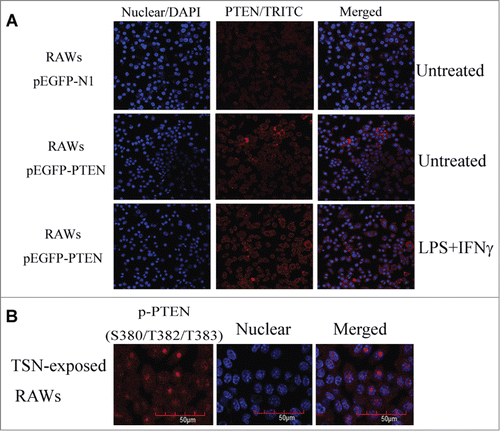
Figure 4. Up-regulating NHERF-1 increased PTEN binding to plasma membrane. (A) TSN-exposed RAWs with different treatment were fixed and stained on glass cover slips. The distribution of PTEN (red) in cells was analyzed by confocal microscopy. DAPI, blue. (B) The indicated p-PTEN was determined in nucleus of TSN-exposed RAWs by immunofluorescence analyses.

Figure 5. PTEN cooperated with NHERF-1 impeded M2 phenotype polarization and CCL2 impaired the inhibition. (A, B) CD206+ cells were determined by flow cytometry in co-RAWs with different treatments (pEGFP-PTEN+LPS+IFNγ or rCCL2) and compared with negative control, respectively. The flow cytometry data were representatives of at least 4 separate experiments, results were presented as means ± SEM. #P < 0.05; ##P < 0.01. (C, D, E) Transfection of PTEN gene with/without enriched NHERF-1 in TSN-exposed RAWs and their phenotype identification of surface markers (M1 phenotype genes [iNOS] and M2 phenotype genes [Arg1]) was primitively determined, then subsequently detected TSN-exposed RAWs stimulated with rCCL2 (250 ng/ml) for 24 h compared with control group by Western blot assay. Further their supernatant effects on cell growth in 4T1 cells were figured up. Immunoblotting data were representatives of 3 separate experiments, *P < 0.05; **P < 0.01. Cells were counted every day. Data for the total number of cells (mean for triplicate cultures).
![Figure 5. PTEN cooperated with NHERF-1 impeded M2 phenotype polarization and CCL2 impaired the inhibition. (A, B) CD206+ cells were determined by flow cytometry in co-RAWs with different treatments (pEGFP-PTEN+LPS+IFNγ or rCCL2) and compared with negative control, respectively. The flow cytometry data were representatives of at least 4 separate experiments, results were presented as means ± SEM. #P < 0.05; ##P < 0.01. (C, D, E) Transfection of PTEN gene with/without enriched NHERF-1 in TSN-exposed RAWs and their phenotype identification of surface markers (M1 phenotype genes [iNOS] and M2 phenotype genes [Arg1]) was primitively determined, then subsequently detected TSN-exposed RAWs stimulated with rCCL2 (250 ng/ml) for 24 h compared with control group by Western blot assay. Further their supernatant effects on cell growth in 4T1 cells were figured up. Immunoblotting data were representatives of 3 separate experiments, *P < 0.05; **P < 0.01. Cells were counted every day. Data for the total number of cells (mean for triplicate cultures).](/cms/asset/f46ef0b3-2530-483d-873d-661d00cbab5c/kcbt_a_1002353_f0005_c.gif)
