885
Views
5
CrossRef citations to date
0
Altmetric
Research Paper

Downregulation of hPMC2 imparts chemotherapeutic sensitivity to alkylating agents in breast cancer cells

, , , &
Pages 518-527 | Received 18 Sep 2014, Accepted 03 Feb 2015, Published online: 07 Apr 2015

Figures & data

Figure 1. Enhanced temozolomide-induced toxicity in hPMC2 downregulated MDA-MB-231 cells. MDA-MB-231 cells were transfected with control or hPMC2 miRNAs (clones 2236 and/or 2315) and analyzed via (A) RT-PCR for hPMC2 and ISG20 levels. Cells were transfected with a mix of both miRNA clones. Transcript levels are expressed relative to GAPDH control and are based on 3 independent experiments. (B) Western blot for hPMC2 levels. Blots were probed with actin as a loading control. Image shown is a representative protein gel blot of 3 independent experiments. Quantification of hPMC2 expression in MDA-MB-231 cells. hPMC2 expression in control cells was given an arbitrary value of 1 and hPMC2 expression in downregulated cells was plotted relative to control. Error bars indicate SEM of 3 independent experiments. (C) Control and hPMC2 downregulated MDA-MB-231 cells were either untreated or treated with 250 μM TMZ for 24 hours. Genomic DNA was isolated from cells and a biotinylated Aldehyde-Reactive Probe (ARP) was used to detect the abasic sites. Error bars indicate SEM of 2 independent experiments with triplicates for each treatment. a, significance (P < 0.05) vs. untreated cells; b, significance (P < 0.05) vs. control transfected cells with the same treatment. (D) MDA-MB-231 cells were either untreated or treated with increasing concentrations of TMZ for 48 hours and maintained for a week. MTT assay was performed and the bars represent the fold change in % survival relative to untreated cells. Error bars indicate SEM of 2 independent experiments with triplicates for each treatment. (E) Control and hPMC2 downregulated MDA-MB-231 cells were either untreated or treated with 250 μM TMZ for 48 hours and maintained for a week. MTT assay was performed and the bars represent the fold change in % survival. Error bars indicate SEM of 2 independent experiments with triplicates for each treatment. a, significance (P < 0.05) vs. untreated cells; b, significance (P < 0.05) vs. control transfected cells with the same treatment.
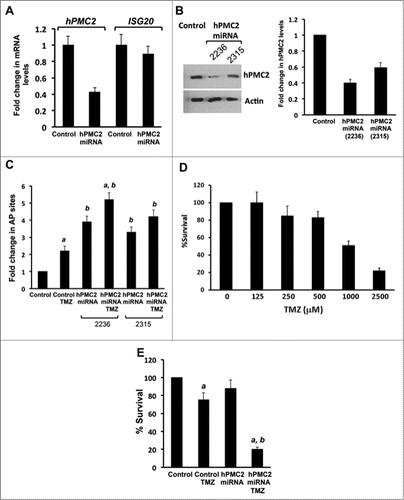
Figure 1. Enhanced temozolomide-induced toxicity in hPMC2 downregulated MDA-MB-231 cells. MDA-MB-231 cells were transfected with control or hPMC2 miRNAs (clones 2236 and/or 2315) and analyzed via (A) RT-PCR for hPMC2 and ISG20 levels. Cells were transfected with a mix of both miRNA clones. Transcript levels are expressed relative to GAPDH control and are based on 3 independent experiments. (B) Western blot for hPMC2 levels. Blots were probed with actin as a loading control. Image shown is a representative protein gel blot of 3 independent experiments. Quantification of hPMC2 expression in MDA-MB-231 cells. hPMC2 expression in control cells was given an arbitrary value of 1 and hPMC2 expression in downregulated cells was plotted relative to control. Error bars indicate SEM of 3 independent experiments. (C) Control and hPMC2 downregulated MDA-MB-231 cells were either untreated or treated with 250 μM TMZ for 24 hours. Genomic DNA was isolated from cells and a biotinylated Aldehyde-Reactive Probe (ARP) was used to detect the abasic sites. Error bars indicate SEM of 2 independent experiments with triplicates for each treatment. a, significance (P < 0.05) vs. untreated cells; b, significance (P < 0.05) vs. control transfected cells with the same treatment. (D) MDA-MB-231 cells were either untreated or treated with increasing concentrations of TMZ for 48 hours and maintained for a week. MTT assay was performed and the bars represent the fold change in % survival relative to untreated cells. Error bars indicate SEM of 2 independent experiments with triplicates for each treatment. (E) Control and hPMC2 downregulated MDA-MB-231 cells were either untreated or treated with 250 μM TMZ for 48 hours and maintained for a week. MTT assay was performed and the bars represent the fold change in % survival. Error bars indicate SEM of 2 independent experiments with triplicates for each treatment. a, significance (P < 0.05) vs. untreated cells; b, significance (P < 0.05) vs. control transfected cells with the same treatment.
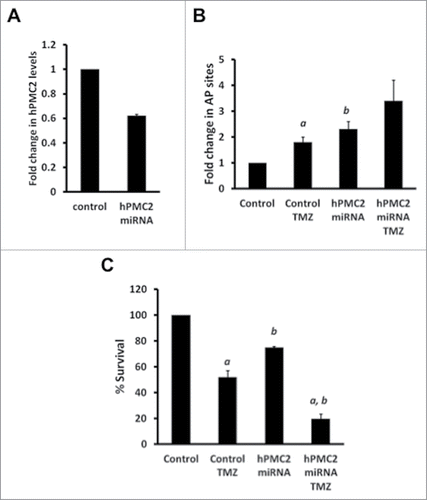
Figure 2. Enhanced temozolomide-induced toxicity in hPMC2 downregulated MDA-MB-468 cells. Control and hPMC2 downregulated MDA-MB-468 cells were analyzed via Western blot for hPMC2 levels. (A) Proteins were extracted from cells and processed for western blot analyses. Blots were probed with actin as a loading control. hPMC2 expression in control cells was given an arbitrary value of 1 and hPMC2 expression in downregulated cells was plotted relative to control. Error bars indicate SEM of 3 independent experiments. (B) Control and hPMC2 downregulated MDA-MB-468 cells were either untreated or treated with 125 μM TMZ for 24 hours. Genomic DNA was isolated from cells and a biotinylated ARP was used to detect the abasic sites. Error bars indicate SEM of 2 independent experiments, with triplicate values for each treatment. a, significance (P < 0.05) vs. untreated cells; b, significance (P < 0.05) vs. control transfected cells with the same treatment. (C) Control and hPMC2 downregulated MDA-MB-468 cells were either untreated or treated with 125 μM TMZ for 48 hours and maintained for a week. MTT assay was performed and the bars represent the fold change in % survival. Error bars indicate SEM of 2 independent experiments with triplicates for each treatment. a, significance (P < 0.05) vs. untreated cells; b, significance (P < 0.05) vs. control transfected cells with the same treatment.
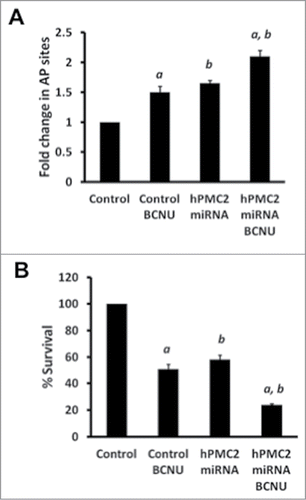
Figure 2. Enhanced temozolomide-induced toxicity in hPMC2 downregulated MDA-MB-468 cells. Control and hPMC2 downregulated MDA-MB-468 cells were analyzed via Western blot for hPMC2 levels. (A) Proteins were extracted from cells and processed for western blot analyses. Blots were probed with actin as a loading control. hPMC2 expression in control cells was given an arbitrary value of 1 and hPMC2 expression in downregulated cells was plotted relative to control. Error bars indicate SEM of 3 independent experiments. (B) Control and hPMC2 downregulated MDA-MB-468 cells were either untreated or treated with 125 μM TMZ for 24 hours. Genomic DNA was isolated from cells and a biotinylated ARP was used to detect the abasic sites. Error bars indicate SEM of 2 independent experiments, with triplicate values for each treatment. a, significance (P < 0.05) vs. untreated cells; b, significance (P < 0.05) vs. control transfected cells with the same treatment. (C) Control and hPMC2 downregulated MDA-MB-468 cells were either untreated or treated with 125 μM TMZ for 48 hours and maintained for a week. MTT assay was performed and the bars represent the fold change in % survival. Error bars indicate SEM of 2 independent experiments with triplicates for each treatment. a, significance (P < 0.05) vs. untreated cells; b, significance (P < 0.05) vs. control transfected cells with the same treatment.
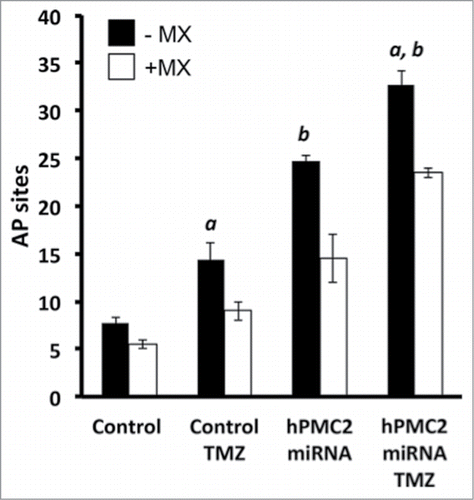
Figure 3. Enhanced BCNU-induced toxicity in hPMC2 downregulated MDA-MB-231 cells. (A) Control and hPMC2 downregulated MDA-MB-231 cells were either untreated or treated with 50 μM BCNU for 24 hours. Genomic DNA was isolated from cells and a biotinylated ARP was used to detect the abasic sites. Error bars indicate SEM of 2 independent experiments with triplicates for each treatment. a, significance (P < 0.05) vs. untreated cells; b, significance (P < 0.05) vs. control transfected cells with the same treatment. (B) Control and hPMC2 downregulated MDA-MB-231 cells were either untreated or treated with 50 μM BCNU for 48 hours and maintained for a week. MTT assay was performed and the bars represent the fold change in % survival. Error bars indicate SEM of 2 independent experiments with triplicates for each treatment. a, significance (P < 0.05) vs. untreated cells; b, significance (P < 0.05) vs. control transfected cells with the same treatment.

Figure 3. Enhanced BCNU-induced toxicity in hPMC2 downregulated MDA-MB-231 cells. (A) Control and hPMC2 downregulated MDA-MB-231 cells were either untreated or treated with 50 μM BCNU for 24 hours. Genomic DNA was isolated from cells and a biotinylated ARP was used to detect the abasic sites. Error bars indicate SEM of 2 independent experiments with triplicates for each treatment. a, significance (P < 0.05) vs. untreated cells; b, significance (P < 0.05) vs. control transfected cells with the same treatment. (B) Control and hPMC2 downregulated MDA-MB-231 cells were either untreated or treated with 50 μM BCNU for 48 hours and maintained for a week. MTT assay was performed and the bars represent the fold change in % survival. Error bars indicate SEM of 2 independent experiments with triplicates for each treatment. a, significance (P < 0.05) vs. untreated cells; b, significance (P < 0.05) vs. control transfected cells with the same treatment.

Figure 4. Treatment with MX results in a decrease in detectable AP sites. Control and hPMC2 downregulated MDA-MB-231 cells were either untreated or treated with 250 μM TMZ for 24 h. A parallel set of control and hPMC2 downregulated cells with and without TMZ was treated with 12.5 mM MX. Genomic DNA was isolated from cells and a biotinylated ARP was used to detect the abasic sites. Black columns in the bar graph represent number of AP sites in cells with or without TMZ treatment while the white columns represent the number of AP sites due to MX treatment with or without TMZ. The bracket represents the decrease in the number of detectable AP sites due to MX treatment. Error bars indicate SEM of 2 independent experiments with triplicates for each treatment. a, significance (P < 0.05) vs. untreated cells; b, significance (P < 0.05) vs. control transfected cells with the same treatment.

Figure 4. Treatment with MX results in a decrease in detectable AP sites. Control and hPMC2 downregulated MDA-MB-231 cells were either untreated or treated with 250 μM TMZ for 24 h. A parallel set of control and hPMC2 downregulated cells with and without TMZ was treated with 12.5 mM MX. Genomic DNA was isolated from cells and a biotinylated ARP was used to detect the abasic sites. Black columns in the bar graph represent number of AP sites in cells with or without TMZ treatment while the white columns represent the number of AP sites due to MX treatment with or without TMZ. The bracket represents the decrease in the number of detectable AP sites due to MX treatment. Error bars indicate SEM of 2 independent experiments with triplicates for each treatment. a, significance (P < 0.05) vs. untreated cells; b, significance (P < 0.05) vs. control transfected cells with the same treatment.

Figure 5. TMZ-induced increase in DNA damage in hPMC2 downregulated MDA-MB-231 cells. MDA-MB-231 cells were transfected with hPMC2 miRNA and were either untreated or treated with 250 μM TMZ for 24 hours and analyzed via Western blot for APE1, γ-H2AX, and actin levels. (A) Representative protein gel blot of APE1 and actin levels of 2 independent experiments. (B) Representative western blot of γ-H2AX and actin levels of 2 independent experiments. (C) Quantification of γ-H2AX expression in MDA-MB-231 cells. γ-H2AX expression in control cells was given an arbitrary value of 1 and γ-H2AX expression in downregulated cells was plotted relative to control. Error bars indicate SEM of 2 independent experiments. a, significance (P < 0.05) vs. untreated cells; b, significance (P < 0.05) vs. control transfected cells with the same treatment. (D) Cells were analyzed using comet assay. Results are expressed in terms of the Olive Moment, which is the summation of each tail intensity integral value, multiplied by its relative distance from the center of the head and divided by the total comet intensity.
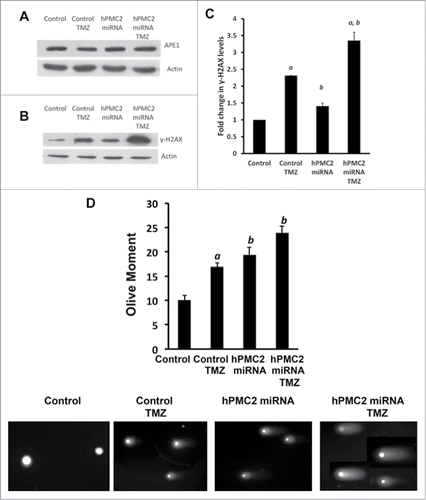
Figure 5. TMZ-induced increase in DNA damage in hPMC2 downregulated MDA-MB-231 cells. MDA-MB-231 cells were transfected with hPMC2 miRNA and were either untreated or treated with 250 μM TMZ for 24 hours and analyzed via Western blot for APE1, γ-H2AX, and actin levels. (A) Representative protein gel blot of APE1 and actin levels of 2 independent experiments. (B) Representative western blot of γ-H2AX and actin levels of 2 independent experiments. (C) Quantification of γ-H2AX expression in MDA-MB-231 cells. γ-H2AX expression in control cells was given an arbitrary value of 1 and γ-H2AX expression in downregulated cells was plotted relative to control. Error bars indicate SEM of 2 independent experiments. a, significance (P < 0.05) vs. untreated cells; b, significance (P < 0.05) vs. control transfected cells with the same treatment. (D) Cells were analyzed using comet assay. Results are expressed in terms of the Olive Moment, which is the summation of each tail intensity integral value, multiplied by its relative distance from the center of the head and divided by the total comet intensity.

Figure 6. hPMC2 expression in human breast tissue samples. Sections obtained from normal breast and breast tumors were stained for endogenous hPMC2 protein.
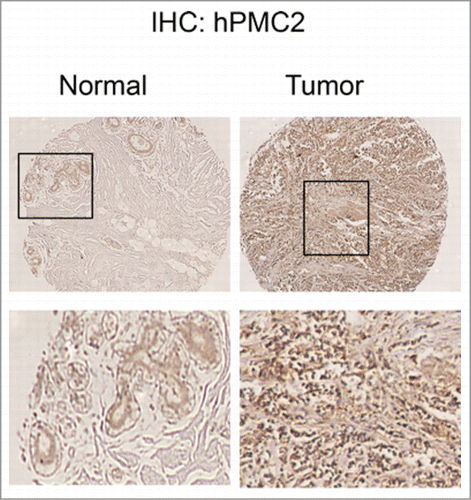
Figure 6. hPMC2 expression in human breast tissue samples. Sections obtained from normal breast and breast tumors were stained for endogenous hPMC2 protein.

Table 1. Means and paired t-test p-values for hPMC2 expression in 48 matched pairs

Reprints and Corporate Permissions

Please note: Selecting permissions does not provide access to the full text of the article, please see our help page How do I view content?

To request a reprint or corporate permissions for this article, please click on the relevant link below:

Academic Permissions

Please note: Selecting permissions does not provide access to the full text of the article, please see our help page How do I view content?

Obtain permissions instantly via Rightslink by clicking on the button below:

If you are unable to obtain permissions via Rightslink, please complete and submit this Permissions form. For more information, please visit our Permissions help page.