1,725
Views
42
CrossRef citations to date
0
Altmetric
Research Paper

Antagonistic effects of chloroquine on autophagy occurrence potentiate the anticancer effects of everolimus on renal cancer cells

, , , , , , , , , , & show all
Pages 567-579 | Received 16 Oct 2014, Accepted 09 Feb 2015, Published online: 11 Apr 2015

Figures & data

Table 1. Everolimus and chloroquine IC50 values (μM) in renal cancer cell lines

Table 2. Combination Index (CI) and Dose Reduction Index (DRI) Values for everolimus and chloroquine (RAD/CLC) combinations

Figure 1. Evaluation of everolimus and chloroquine effect on renal cancer cells growth. The curves show the percentage of renal cancer cells growth following everolimus (A) and chloroquine (B) dose-dependent exposure for 72 h. Each point is the average of at least 3 repeated experiments (Bars, SEs).
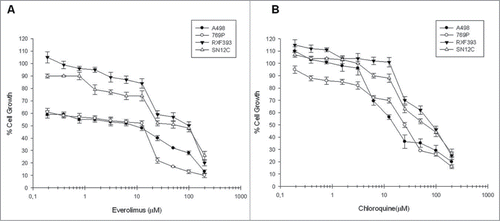
Figure 1. Evaluation of everolimus and chloroquine effect on renal cancer cells growth. The curves show the percentage of renal cancer cells growth following everolimus (A) and chloroquine (B) dose-dependent exposure for 72 h. Each point is the average of at least 3 repeated experiments (Bars, SEs).

Figure 2. FACS analysis after double labeling A498 cell line with PI and Annexin V. The cells were treated with CLC and RAD alone and in sequence, compared to the control. Insets show the percentage of cells in the different quadrants. UL = Upper Left (necrosis); UR = Upper Right (late apoptosis); LL = Lower Left (viable); LR = Lower Right (early apoptosis). Untreated cells, CTR; CLC added for 72 h and RAD for the last 48 h, CLC→RAD; RAD added for 72 h and CLC added for the last 48 h, RAD→CLC; RAD and CLC added simultaneously for 72 h, RAD/CLC 72h. The figure is representative of 3 different experiments that always gave similar results.
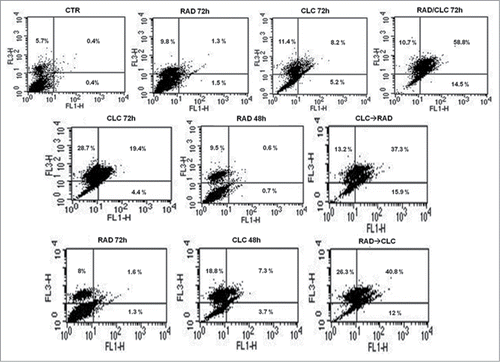
Figure 2. FACS analysis after double labeling A498 cell line with PI and Annexin V. The cells were treated with CLC and RAD alone and in sequence, compared to the control. Insets show the percentage of cells in the different quadrants. UL = Upper Left (necrosis); UR = Upper Right (late apoptosis); LL = Lower Left (viable); LR = Lower Right (early apoptosis). Untreated cells, CTR; CLC added for 72 h and RAD for the last 48 h, CLC→RAD; RAD added for 72 h and CLC added for the last 48 h, RAD→CLC; RAD and CLC added simultaneously for 72 h, RAD/CLC 72h. The figure is representative of 3 different experiments that always gave similar results.

Figure 3. FACS analysis after double labeling RXF393 cell line with PI and Annexin V. The experimental conditions are identical to those shown in .
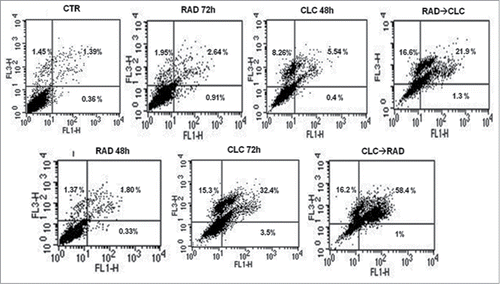
Figure 3. FACS analysis after double labeling RXF393 cell line with PI and Annexin V. The experimental conditions are identical to those shown in Figure 2.

Figure 4. Autophagy evaluation after treatment with CLC and/or RAD alone or in sequence. A498 (A) and RXF393 (B) cells were incubated with MDC and analyzed by flow cytometry as described in “Materials and Methods” in order to evaluate the autophagy onset. Untreated cells unexposed to MDC, CTR; untreated cells exposed to MDC, CTR+; CLC added for 48 h and RAD 72 h, RAD→CLC; CLC added for 72 h and RAD for the last 48 h, CLC→RAD; CLC and RAD added for 72 h, RAD/CLC 72h. The experiments were repeated at least 3 times and always gave similar results (Bars, SDs).
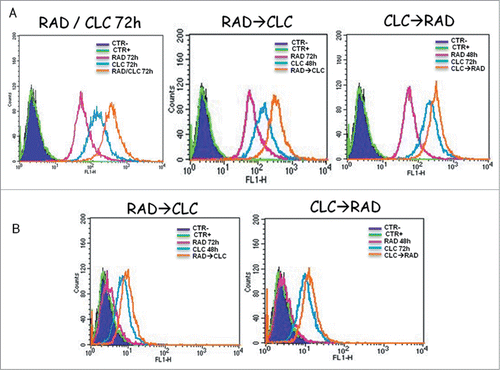
Figure 4. Autophagy evaluation after treatment with CLC and/or RAD alone or in sequence. A498 (A) and RXF393 (B) cells were incubated with MDC and analyzed by flow cytometry as described in “Materials and Methods” in order to evaluate the autophagy onset. Untreated cells unexposed to MDC, CTR; untreated cells exposed to MDC, CTR+; CLC added for 48 h and RAD 72 h, RAD→CLC; CLC added for 72 h and RAD for the last 48 h, CLC→RAD; CLC and RAD added for 72 h, RAD/CLC 72h. The experiments were repeated at least 3 times and always gave similar results (Bars, SDs).

Figure 5. Evaluation of Beclin-1 and Bcl-2 interaction. (A) RXF393 were treated with CLC and RAD alone or in sequence. Then we performed western blotting assay (WB) for the expression of the total Bcl-2 and Beclin-1 proteins and immunoprecipitation (IP) for the evaluation of Bcl-2/Beclin-1 and Beclin-1/Bcl-2 complex formation. (B) Representation of the complexes expressed as the ratio between the relative intensities of the bands associated with the Bcl-2/Beclin-1 and Beclin-1/Bcl-2 complexes vs. the bands associated with total Bcl-2 and Beclin-1, respectively. The intensities of the bands were expressed as arbitrary units when compared to those of the untreated cells (CTR) The figure is representative of 3 different experiments that always gave similar results.
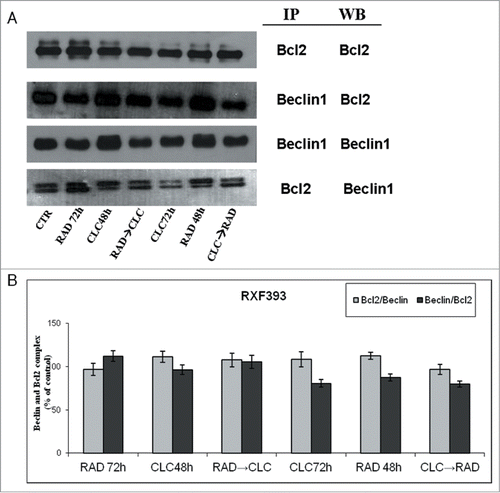
Figure 5. Evaluation of Beclin-1 and Bcl-2 interaction. (A) RXF393 were treated with CLC and RAD alone or in sequence. Then we performed western blotting assay (WB) for the expression of the total Bcl-2 and Beclin-1 proteins and immunoprecipitation (IP) for the evaluation of Bcl-2/Beclin-1 and Beclin-1/Bcl-2 complex formation. (B) Representation of the complexes expressed as the ratio between the relative intensities of the bands associated with the Bcl-2/Beclin-1 and Beclin-1/Bcl-2 complexes vs. the bands associated with total Bcl-2 and Beclin-1, respectively. The intensities of the bands were expressed as arbitrary units when compared to those of the untreated cells (CTR) The figure is representative of 3 different experiments that always gave similar results.

Figure 6. Evaluation of pathways involved in the regulation of proliferation and survival. (A) RXF393 were treated with RAD and/or CLC alone or in combination. Thereafter, both the activity and the expression of the different proteins were evaluated. Expression of the house-keeping protein α-tubulin was used as loading control. (B) Representation of the intensities of the bands associated to the different proteins normalized for the expression of the total proteins. The intensities of the bands were expressed as arbitrary units when compared to those of the untreated cells. The figure is representative of 3 different experiments that always gave similar results.
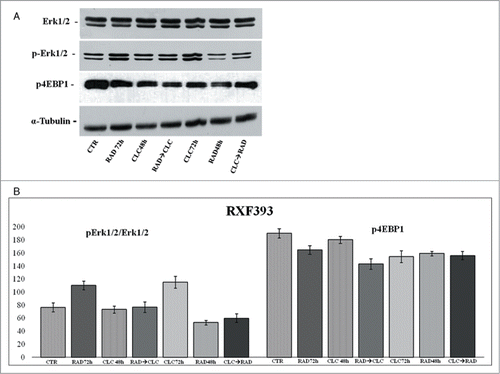
Figure 6. Evaluation of pathways involved in the regulation of proliferation and survival. (A) RXF393 were treated with RAD and/or CLC alone or in combination. Thereafter, both the activity and the expression of the different proteins were evaluated. Expression of the house-keeping protein α-tubulin was used as loading control. (B) Representation of the intensities of the bands associated to the different proteins normalized for the expression of the total proteins. The intensities of the bands were expressed as arbitrary units when compared to those of the untreated cells. The figure is representative of 3 different experiments that always gave similar results.
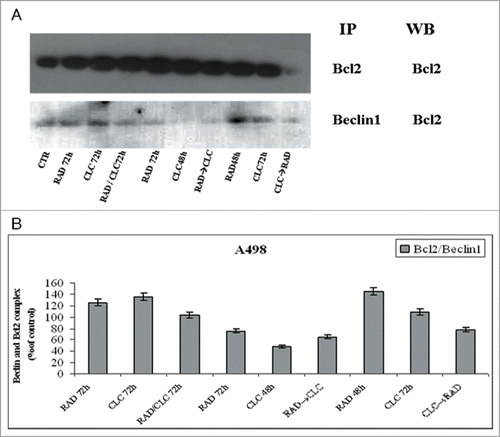
Figure 7. Evaluation of Beclin-1 and Bcl-2 interaction. (A) A498 were treated with CLC and RAD alone or in sequence. Thereafter we performed protein gel blotting assay (WB) for the expression of the total Bcl-2 protein and immunoprecipitation (IP) for the evaluation of Bcl-2/Beclin-1 complex formation. (B) Representation of the Bcl-2/Beclin-1 complexes expressed as the ratio between the relative intensities of the bands of the complex versus the bands associated with total Bcl-2. The intensities of the bands were expressed as arbitrary units when compared to those of the untreated cells. The figure is representative of 3 different experiments that always gave similar results.
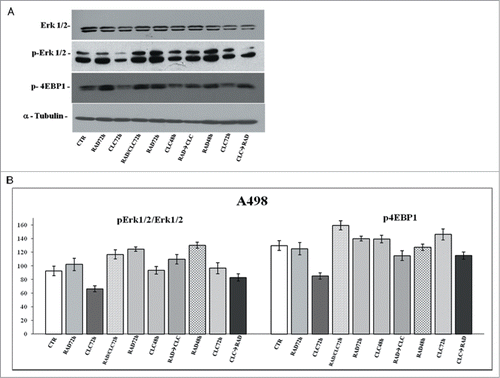
Figure 7. Evaluation of Beclin-1 and Bcl-2 interaction. (A) A498 were treated with CLC and RAD alone or in sequence. Thereafter we performed protein gel blotting assay (WB) for the expression of the total Bcl-2 protein and immunoprecipitation (IP) for the evaluation of Bcl-2/Beclin-1 complex formation. (B) Representation of the Bcl-2/Beclin-1 complexes expressed as the ratio between the relative intensities of the bands of the complex versus the bands associated with total Bcl-2. The intensities of the bands were expressed as arbitrary units when compared to those of the untreated cells. The figure is representative of 3 different experiments that always gave similar results.

Figure 8. Evaluation of pathways involved in the regulation of proliferation and survival. (A) A498 were treated with RAD and/or CLC alone or in combination. Thereafter, both the activity and the expression of the different proteins were evaluated after western blotting assay with specific antibodies, as described in “Materials and Methods.” Expression of the house-keeping protein α-tubulin was used as loading control. (B) Representation of the intensities of the bands associated to the different proteins normalized for the expression of the total proteins. The intensities of the bands were expressed as arbitrary units when compared to those of the untreated cells. The figure is representative of 3 different experiments that always gave similar results.

Figure 8. Evaluation of pathways involved in the regulation of proliferation and survival. (A) A498 were treated with RAD and/or CLC alone or in combination. Thereafter, both the activity and the expression of the different proteins were evaluated after western blotting assay with specific antibodies, as described in “Materials and Methods.” Expression of the house-keeping protein α-tubulin was used as loading control. (B) Representation of the intensities of the bands associated to the different proteins normalized for the expression of the total proteins. The intensities of the bands were expressed as arbitrary units when compared to those of the untreated cells. The figure is representative of 3 different experiments that always gave similar results.

Figure 9. Evaluation of caspases involved in apoptotic process. A498 were treated with RAD and/or CLC alone or in combination. Thereafter, both the activity and the expression of the different proteins were evaluated after protein gel blotting assay with specific antibodies, as described in “Materials and Methods.” Expression of the house-keeping protein α-tubulin was used as loading control.
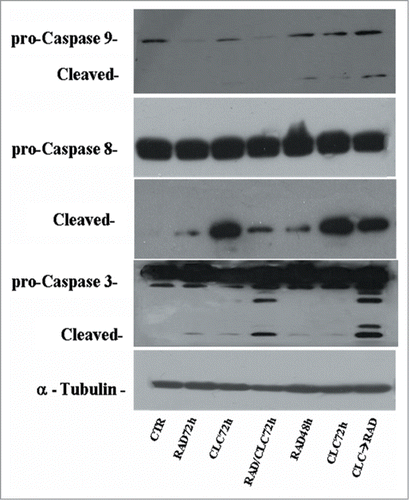
Figure 9. Evaluation of caspases involved in apoptotic process. A498 were treated with RAD and/or CLC alone or in combination. Thereafter, both the activity and the expression of the different proteins were evaluated after protein gel blotting assay with specific antibodies, as described in “Materials and Methods.” Expression of the house-keeping protein α-tubulin was used as loading control.

Figure 10. Chloroquine blocks autophagy induced by everolimus and consequently strengthens the apoptosis induced by the latter. mTOR is involved in the apoptosis and autophagy regulation: everolimus inhibits the mTOR pathway triggering both apoptosis and early autophagy; the addition of chloroquine inhibits late autophagy and consequently blocks autophagic flux thus inducing a switch from autophagy to apoptosis. These effects mediate a potentiation of the growth inhibition of renal cancer cells due to the abrogation of a protective anti-apoptotic and autophagic pathway.
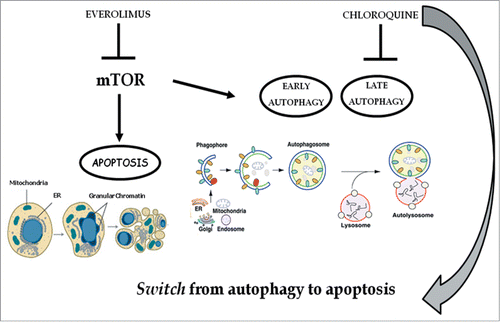
Figure 10. Chloroquine blocks autophagy induced by everolimus and consequently strengthens the apoptosis induced by the latter. mTOR is involved in the apoptosis and autophagy regulation: everolimus inhibits the mTOR pathway triggering both apoptosis and early autophagy; the addition of chloroquine inhibits late autophagy and consequently blocks autophagic flux thus inducing a switch from autophagy to apoptosis. These effects mediate a potentiation of the growth inhibition of renal cancer cells due to the abrogation of a protective anti-apoptotic and autophagic pathway.

Reprints and Corporate Permissions

Please note: Selecting permissions does not provide access to the full text of the article, please see our help page How do I view content?

To request a reprint or corporate permissions for this article, please click on the relevant link below:

Academic Permissions

Please note: Selecting permissions does not provide access to the full text of the article, please see our help page How do I view content?

Obtain permissions instantly via Rightslink by clicking on the button below:

If you are unable to obtain permissions via Rightslink, please complete and submit this Permissions form. For more information, please visit our Permissions help page.