1,451
Views
21
CrossRef citations to date
0
Altmetric
Research Paper

GATA-3 augmentation down-regulates Connexin43 in Helicobacter pylori associated gastric carcinogenesis

, , , , , , , , & show all
Pages 987-996 | Received 27 Feb 2015, Accepted 09 Mar 2015, Published online: 29 May 2015

Figures & data

Table 1. Transcriptional Factors DNA array in H. pylori associated gastric carcinogenesis (standardized value)

Figure 1. Comparison of GATA-3 and Cx43 expression among developmental stages of H. pylori associated gastric carcinoma in clinical specimens. (A, B) Quantitative RT-PCR analysis of GATA-3 (A) and Cx43 (B) in H. pylori (-) NGM, H. pylori (+) CAG and GC patients (n=15). *** p < 0.001. (C) Representative images of GATA-3 and Cx43 protein levels in H. pylori (-) NGM, H. pylori (-/+) CAG, IM and GC.
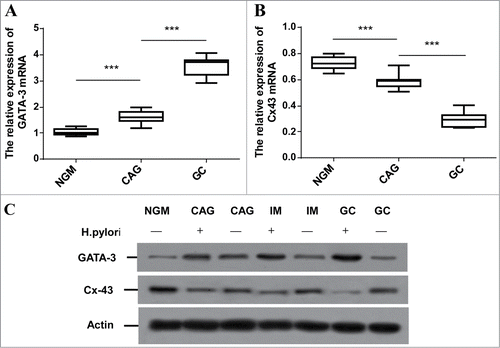
Figure 1. Comparison of GATA-3 and Cx43 expression among developmental stages of H. pylori associated gastric carcinoma in clinical specimens. (A, B) Quantitative RT-PCR analysis of GATA-3 (A) and Cx43 (B) in H. pylori (-) NGM, H. pylori (+) CAG and GC patients (n=15). *** p < 0.001. (C) Representative images of GATA-3 and Cx43 protein levels in H. pylori (-) NGM, H. pylori (-/+) CAG, IM and GC.

Figure 2. The effects of H. pylori on GATA-3 and Cx43 expressions in GES-1 cells. (A, B) Quantitative RT-PCR analysis of GATA-3 (A) and Cx43 (B) in GES-1 cells with H. pylori 24 and 48 hours infections. ** p < 0.01; *** p < 0.001. (C) Morphology of normal GES-1 cells and 24/48 hours H. pylori infected GES-1 cells. (D) Western blot analysis of GATA-3 and Cx43 protein levels in GES-1 cells under 24 and 48 hours H. pylori infections.
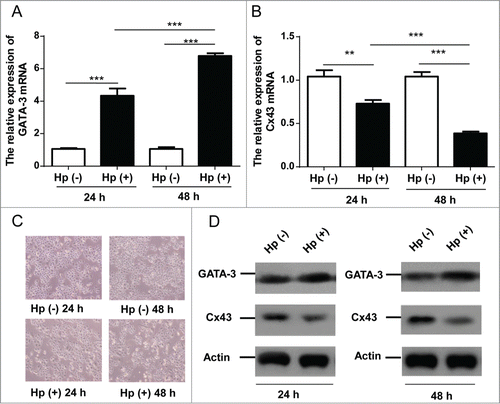
Figure 2. The effects of H. pylori on GATA-3 and Cx43 expressions in GES-1 cells. (A, B) Quantitative RT-PCR analysis of GATA-3 (A) and Cx43 (B) in GES-1 cells with H. pylori 24 and 48 hours infections. ** p < 0.01; *** p < 0.001. (C) Morphology of normal GES-1 cells and 24/48 hours H. pylori infected GES-1 cells. (D) Western blot analysis of GATA-3 and Cx43 protein levels in GES-1 cells under 24 and 48 hours H. pylori infections.

Figure 3. GATA-3 negatively regulates Cx43 by directly binding to its promoters. (A, B) Quantitative RT-PCR analysis of GATA-3 (A) and Cx43 (B) levels in H. pylori infected GES-1 cells treated with a scramble control, GATA-3 siRNA-1, GATA-3 siRNA-2. (C) Western blot analysis of GATA-3 and Cx43 protein levels in H. pylori infected GES-1 cells treated with a scramble control, GATA-3 siRNA-1, and GATA-3 siRNA-2. (D) GATA-3 direct binds to Cx43 promoters. HEK-293T cells co-transfected with GATA-3 and Cx43-pGL3 plasmids. The results are displayed as the ratio of firefly luciferase activity in the pGL3-Cx43-GATA-3-transfected cells to the activity in the pGL3-Cx43 controls. *** p < 0.001.
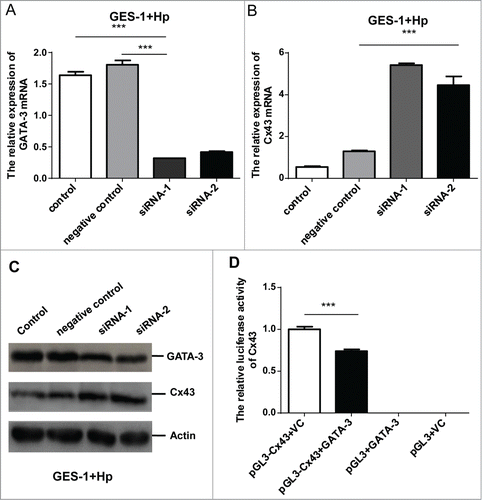
Figure 3. GATA-3 negatively regulates Cx43 by directly binding to its promoters. (A, B) Quantitative RT-PCR analysis of GATA-3 (A) and Cx43 (B) levels in H. pylori infected GES-1 cells treated with a scramble control, GATA-3 siRNA-1, GATA-3 siRNA-2. (C) Western blot analysis of GATA-3 and Cx43 protein levels in H. pylori infected GES-1 cells treated with a scramble control, GATA-3 siRNA-1, and GATA-3 siRNA-2. (D) GATA-3 direct binds to Cx43 promoters. HEK-293T cells co-transfected with GATA-3 and Cx43-pGL3 plasmids. The results are displayed as the ratio of firefly luciferase activity in the pGL3-Cx43-GATA-3-transfected cells to the activity in the pGL3-Cx43 controls. *** p < 0.001.

Figure 4. The effects of H. pylori on GATA-3 and Cx43 expression in Mongolian gerbils. (A) The alterative GATA-3 and Cx43 mRNA in Mongolian gerbils with H. pylori 48-week infection (n=10) compared to control group (n=10). *** p < 0.001. (B) The correlation of GATA-3 and Cx43 mRNA levels from Mongolian gerbils (10 from experimental group and 10 from control group). (C) Profile of Mongolian gerbil (upper left); typical macroscopic manifestation of normal stomach in control group (top center) and inflammatory edema in experimental group (upper right); histologic sections of normal gastric mucosa (left bottom), H. pylori induced severe non-atrophic gastritis (bottom center), and H. pylori induced atrophic gastritis (right bottom).
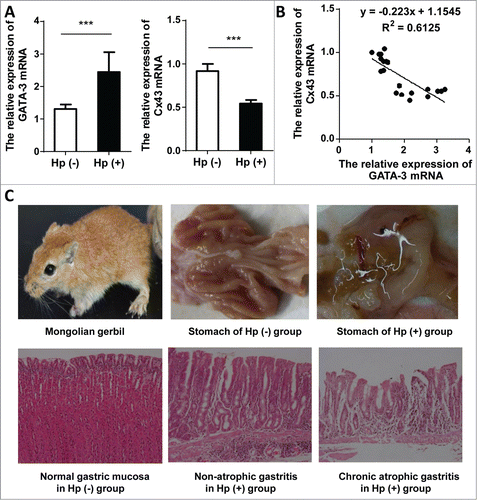
Figure 4. The effects of H. pylori on GATA-3 and Cx43 expression in Mongolian gerbils. (A) The alterative GATA-3 and Cx43 mRNA in Mongolian gerbils with H. pylori 48-week infection (n=10) compared to control group (n=10). *** p < 0.001. (B) The correlation of GATA-3 and Cx43 mRNA levels from Mongolian gerbils (10 from experimental group and 10 from control group). (C) Profile of Mongolian gerbil (upper left); typical macroscopic manifestation of normal stomach in control group (top center) and inflammatory edema in experimental group (upper right); histologic sections of normal gastric mucosa (left bottom), H. pylori induced severe non-atrophic gastritis (bottom center), and H. pylori induced atrophic gastritis (right bottom).
Supplemental material

Supplementary Figures

Download Zip (2.1 MB)

Reprints and Corporate Permissions

Please note: Selecting permissions does not provide access to the full text of the article, please see our help page How do I view content?

To request a reprint or corporate permissions for this article, please click on the relevant link below:

Academic Permissions

Please note: Selecting permissions does not provide access to the full text of the article, please see our help page How do I view content?

Obtain permissions instantly via Rightslink by clicking on the button below:

If you are unable to obtain permissions via Rightslink, please complete and submit this Permissions form. For more information, please visit our Permissions help page.