1,879
Views
37
CrossRef citations to date
0
Altmetric
Research Paper

EGFR inhibitors prevent induction of cancer stem-like cells in esophageal squamous cell carcinoma by suppressing epithelial-mesenchymal transition

, , , , , , , , , , , , , , , & show all
Pages 933-940 | Received 12 Jan 2015, Accepted 09 Apr 2015, Published online: 28 May 2015

Figures & data

Figure 1. EGFR inhibitors suppressed enrichment of CSCs induced by TGF-β1. (A) EPC2T cells and OKF6T cells were treated with or without erlotinib (2.5 μM) and TGF-β1 (5 ng/ml) for 72 hours. CD44 high expressing CSCs were enriched by TGF-β1 and the enrichment of CSCs by TGF-β1 was significantly suppressed by erlotinib. (*P < 0.05 vs. DMSO control, #P < 0.05 vs TGF-β1) (B) EPC2T cells and OKF6T cells were treated with or without cetuximab (10 μg/ml) and TGF-β1 (5 ng/ml) for 72 hours. Fold change of CD44 high expressing CSCs was shown. (*P < 0.05 vs. DMSO control, # P < 0.05 vs TGF-β1)
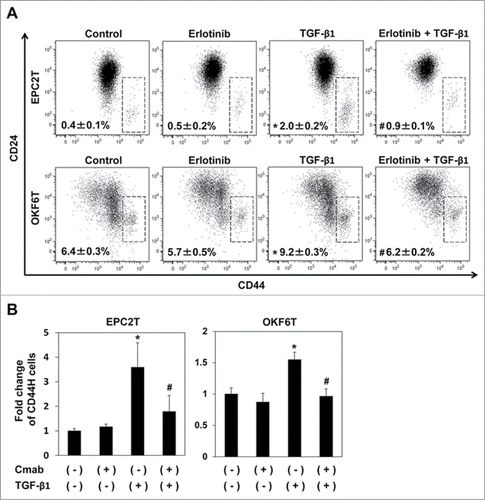
Figure 1. EGFR inhibitors suppressed enrichment of CSCs induced by TGF-β1. (A) EPC2T cells and OKF6T cells were treated with or without erlotinib (2.5 μM) and TGF-β1 (5 ng/ml) for 72 hours. CD44 high expressing CSCs were enriched by TGF-β1 and the enrichment of CSCs by TGF-β1 was significantly suppressed by erlotinib. (*P < 0.05 vs. DMSO control, #P < 0.05 vs TGF-β1) (B) EPC2T cells and OKF6T cells were treated with or without cetuximab (10 μg/ml) and TGF-β1 (5 ng/ml) for 72 hours. Fold change of CD44 high expressing CSCs was shown. (*P < 0.05 vs. DMSO control, # P < 0.05 vs TGF-β1)

Figure 2. EGFR inhibitors suppressed expression of ZEB1 and ZEB2. (A) EPC2T cells were treated with erlotinib for 72 hours and expression levels of ZEB1 and ZEB2 were determined by real-time RT-PCR. (*P < 0.05 vs. DMSO control) (B) EPC2T cells were treated with cetuximab (10 μg/ml) for 72 hours and expression levels of ZEB1 and ZEB2 were determined by real-time RT-PCR. (* P < 0.05 vs. vehicle control)
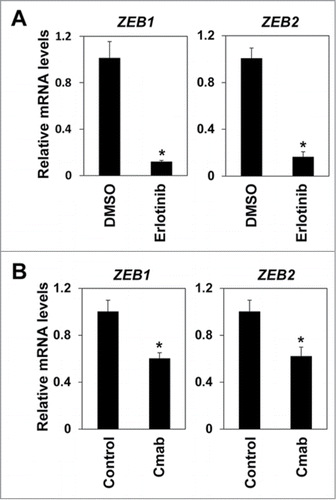
Figure 2. EGFR inhibitors suppressed expression of ZEB1 and ZEB2. (A) EPC2T cells were treated with erlotinib for 72 hours and expression levels of ZEB1 and ZEB2 were determined by real-time RT-PCR. (*P < 0.05 vs. DMSO control) (B) EPC2T cells were treated with cetuximab (10 μg/ml) for 72 hours and expression levels of ZEB1 and ZEB2 were determined by real-time RT-PCR. (* P < 0.05 vs. vehicle control)

Figure 3. Erlotinib upregulated Notch transcriptional factors and induced differentiation. EPC2T cells and OKF6T cells were treated with erlotinib (2.5 μM) for 72 hours and expression levels of indicated genes were determined by real-time RT-PCR. Notch1 and Notch3 are critical transcriptional factors in keratinocyte differentiation. CK13 and involucrin (IVL) are differentiation markers of keratinocytes. (* P < 0.05 vs. DMSO control)
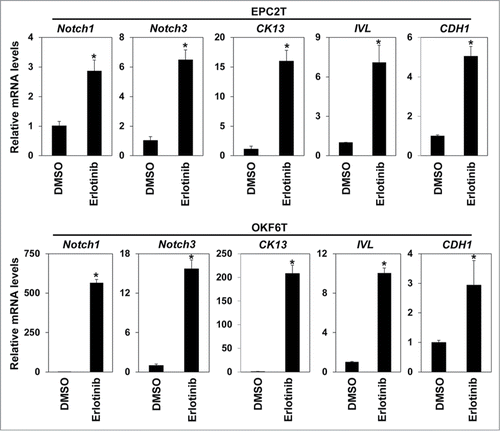
Figure 3. Erlotinib upregulated Notch transcriptional factors and induced differentiation. EPC2T cells and OKF6T cells were treated with erlotinib (2.5 μM) for 72 hours and expression levels of indicated genes were determined by real-time RT-PCR. Notch1 and Notch3 are critical transcriptional factors in keratinocyte differentiation. CK13 and involucrin (IVL) are differentiation markers of keratinocytes. (* P < 0.05 vs. DMSO control)

Figure 4. Erlotinib suppressed tumor growth and invasion as well as enrichment of CSCs in organotypic 3D culture. EPC2T cells and OKF6T cells were cultured in organotypic 3D culture system with or without erlotinib (5 μM). (A) Tissues were stained by hematoxylin and eosin (H&E) (upper panels), anti-phospho EGFR antibody (middle panels) and anti-E-cadherin antibody (lower panels). Scale bar indicates 100 μm. (B) Cell growth was evaluated by Ki-67 staining. Histograms show percentage of Ki-67 positive cells at the basal layer. Scale bar indicates 100 μm. (*P < 0.05 vs. DMSO control) (C) Tissues were stained by anti-CD44 antibody. Scale bar indicates 100 μm.
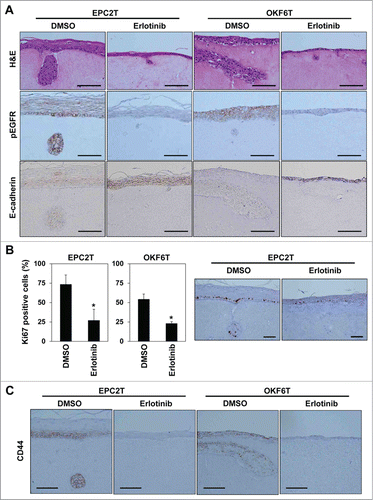
Figure 4. Erlotinib suppressed tumor growth and invasion as well as enrichment of CSCs in organotypic 3D culture. EPC2T cells and OKF6T cells were cultured in organotypic 3D culture system with or without erlotinib (5 μM). (A) Tissues were stained by hematoxylin and eosin (H&E) (upper panels), anti-phospho EGFR antibody (middle panels) and anti-E-cadherin antibody (lower panels). Scale bar indicates 100 μm. (B) Cell growth was evaluated by Ki-67 staining. Histograms show percentage of Ki-67 positive cells at the basal layer. Scale bar indicates 100 μm. (*P < 0.05 vs. DMSO control) (C) Tissues were stained by anti-CD44 antibody. Scale bar indicates 100 μm.

Figure 5. CD44 high expressing CSCs were reduced by erlotinib in organotypic 3D culture. EPC2T cells and OKF6T cells were cultured in organotypic 3D culture system with or without erlotinib (5 μM). Then, tumor cells were isolated from the whole organotypic 3D culture tissue and expression levels of CD24 and CD44 were analyzed by FACS. (*P < 0.05 vs. DMSO control)
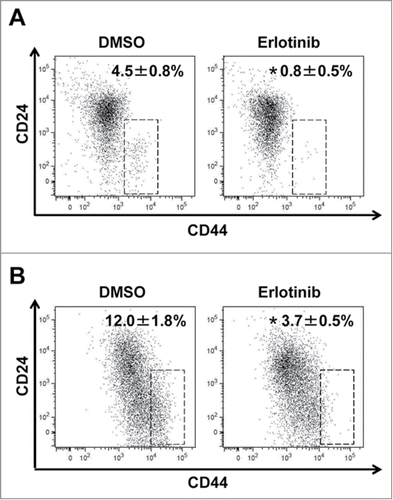
Figure 5. CD44 high expressing CSCs were reduced by erlotinib in organotypic 3D culture. EPC2T cells and OKF6T cells were cultured in organotypic 3D culture system with or without erlotinib (5 μM). Then, tumor cells were isolated from the whole organotypic 3D culture tissue and expression levels of CD24 and CD44 were analyzed by FACS. (*P < 0.05 vs. DMSO control)

Table 1 Primers used for real-time RT-PCR

Supplemental material

Supplementary Figures

Download Zip (562.1 KB)

Reprints and Corporate Permissions

Please note: Selecting permissions does not provide access to the full text of the article, please see our help page How do I view content?

To request a reprint or corporate permissions for this article, please click on the relevant link below:

Academic Permissions

Please note: Selecting permissions does not provide access to the full text of the article, please see our help page How do I view content?

Obtain permissions instantly via Rightslink by clicking on the button below:

If you are unable to obtain permissions via Rightslink, please complete and submit this Permissions form. For more information, please visit our Permissions help page.