2,189
Views
50
CrossRef citations to date
0
Altmetric
Research Paper

Anti-cancer activity of withaferin A in B-cell lymphoma

, , , , , & show all
Pages 1088-1098 | Received 14 Apr 2015, Accepted 25 Apr 2015, Published online: 06 Jul 2015

Figures & data

Figure 1. Effect of WA on the survival of human diffuse large B cell lymphoma, Burkitt's lymphoma, mantle Cell lymphoma, and murine DLBCL cell lines. B cell lymphoma cells were treated with different concentrations of Withaferin A for 48hr and then proliferation and viability was measured by MTT assay. Data points indicate percentage of viable cells of triplicate cultures and an average of at least 2 experiments. The curves are plotted on a log scale with 0.01 µM drug concentration representing no drug added. Bars indicate standard error of the mean.
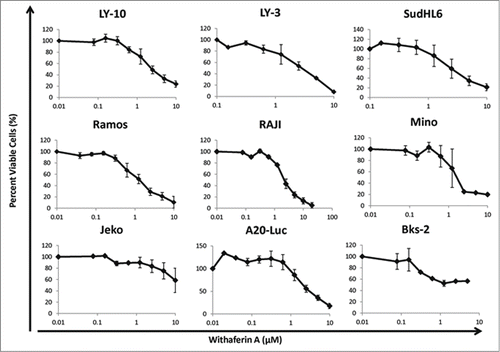
Figure 1. Effect of WA on the survival of human diffuse large B cell lymphoma, Burkitt's lymphoma, mantle Cell lymphoma, and murine DLBCL cell lines. B cell lymphoma cells were treated with different concentrations of Withaferin A for 48hr and then proliferation and viability was measured by MTT assay. Data points indicate percentage of viable cells of triplicate cultures and an average of at least 2 experiments. The curves are plotted on a log scale with 0.01 µM drug concentration representing no drug added. Bars indicate standard error of the mean.

Table 1. Effective Concentrations of Withaferin A on various NHL cell lines

Figure 2. WA induced a G2/M cell cycle arrest in B cell lymphoma accompanied by a decrease in expression of cell cycle regulators. (A) Cultures of human SudHL-6, LY-10, and LY-3 cells (of 0.75 × 10⁶ cells/ml) were treated with different concentrations of WA for 48hr. The cells were then collected and stained for cell cycle analysis. (B) LY-10 and LY-3 cells were treated with 2.5 μM WA and collected at multiple time points. Cells were harvested and total protein was isolated. Immunoblots were probed for cell cycle regulators including Cyclin B1, cdc2, and CDK4. Blots were then stripped and probed for GAPDH. Expression values for each band were normalized to the corresponding GAPDH band.
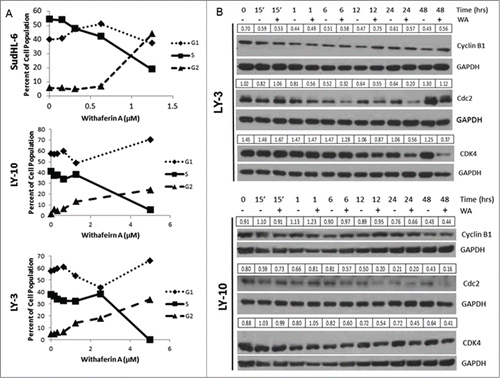
Figure 2. WA induced a G2/M cell cycle arrest in B cell lymphoma accompanied by a decrease in expression of cell cycle regulators. (A) Cultures of human SudHL-6, LY-10, and LY-3 cells (of 0.75 × 10⁶ cells/ml) were treated with different concentrations of WA for 48hr. The cells were then collected and stained for cell cycle analysis. (B) LY-10 and LY-3 cells were treated with 2.5 μM WA and collected at multiple time points. Cells were harvested and total protein was isolated. Immunoblots were probed for cell cycle regulators including Cyclin B1, cdc2, and CDK4. Blots were then stripped and probed for GAPDH. Expression values for each band were normalized to the corresponding GAPDH band.

Figure 3. Withaferin A treatment results in apoptosis of diffuse Large B cell lymphoma lines. (A) LY-10 and LY-3 cells were treated with 2.5 µM WA for 48hrs. Early apoptotic cells were detected by flow cytometry with Annexin-V staining. (B) Bcl-2 and Mcl1 protein expression in LY-10 and LY-3 lymphoma cells were determined by western blot analysis. (C) Cleaved Caspase 3 and total Caspase 3 levels were measured in WA treated LY-3 lymphoma cells. Band intensity values are normalized to the control GAPDH.
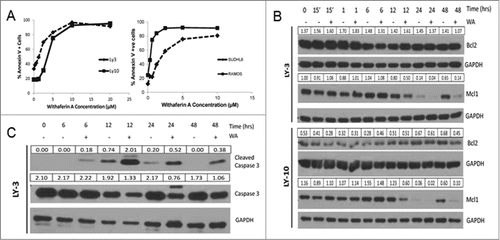
Figure 3. Withaferin A treatment results in apoptosis of diffuse Large B cell lymphoma lines. (A) LY-10 and LY-3 cells were treated with 2.5 µM WA for 48hrs. Early apoptotic cells were detected by flow cytometry with Annexin-V staining. (B) Bcl-2 and Mcl1 protein expression in LY-10 and LY-3 lymphoma cells were determined by western blot analysis. (C) Cleaved Caspase 3 and total Caspase 3 levels were measured in WA treated LY-3 lymphoma cells. Band intensity values are normalized to the control GAPDH.

Figure 4. Withaferin A inhibits NF-κB nuclear translocation. (A) Cultures of 0.75 ×10⁶ cells/ml human LY-10 and LY-3 lymphoma cells were treated with 2.5 µM WA for 2 and 4 hours. Cells were then removed from drug and fixed to be stained for the p-65 subunit of NF-kB. Images were taken through fluorescent microscopy to observe the cytoplasmic and nuclear location of NF-kB. (B) Sixteen fields were counted and data represents mean ± standard deviation of triplicate samples. Statistical significance of difference between groups was determined by ANOVA. * P<0.02 and ** P < 0.001. (C) LY-10 and LY-3 lymphoma cells were treated with 2.5 μM WA and collected at multiple time points. Cells were harvested and total protein was isolated. Western blots of lysates were probed for pIKKα/β and total IKK α/β. Blots were then stripped and probed for GAPDH. Expression values for IKK α/β band were normalized to the corresponding GAPDH band and the pIKKα/β values were normalized to the total IKKα/β. ND = not determined due to total IKKα/β band being undetectable.
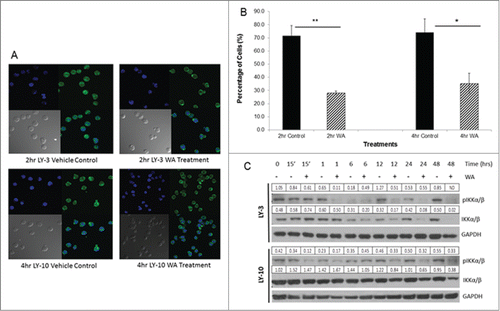
Figure 4. Withaferin A inhibits NF-κB nuclear translocation. (A) Cultures of 0.75 ×10⁶ cells/ml human LY-10 and LY-3 lymphoma cells were treated with 2.5 µM WA for 2 and 4 hours. Cells were then removed from drug and fixed to be stained for the p-65 subunit of NF-kB. Images were taken through fluorescent microscopy to observe the cytoplasmic and nuclear location of NF-kB. (B) Sixteen fields were counted and data represents mean ± standard deviation of triplicate samples. Statistical significance of difference between groups was determined by ANOVA. * P<0.02 and ** P < 0.001. (C) LY-10 and LY-3 lymphoma cells were treated with 2.5 μM WA and collected at multiple time points. Cells were harvested and total protein was isolated. Western blots of lysates were probed for pIKKα/β and total IKK α/β. Blots were then stripped and probed for GAPDH. Expression values for IKK α/β band were normalized to the corresponding GAPDH band and the pIKKα/β values were normalized to the total IKKα/β. ND = not determined due to total IKKα/β band being undetectable.

Figure 5. Effect of WA treatment on the pro-survival factors of B cell lymphomas; all client proteins of Hsp90. (A) LY-10 and LY-3 lymphoma cells were treated with 2.5 µM WA for varying time points or the appropriate volume of DMSO vehicle. Cells were harvested and total protein was isolated. Western blots of lysates were first probed for pAkt (Ser473), stripped and then for total Akt. (B) LY-10 and LY-3 cells treated with 2.5 µM WA were first probed for phosphorylated-SFK with pSrc (Y416) antibody and then probed for total Lyn, an SFK. (C) LY-10 and LY-3 cell lysates were probed for total protein levels of Syk and Btk. (D) LY-10 and LY-3 cells treated with 2.5 µM WA were probed for total expression of Hsp90β and Hsp70. Densitometry values for total protein were normalized to corresponding GAPDH band, whereas the phosphoprotein values were normalized to the corresponding total protein.
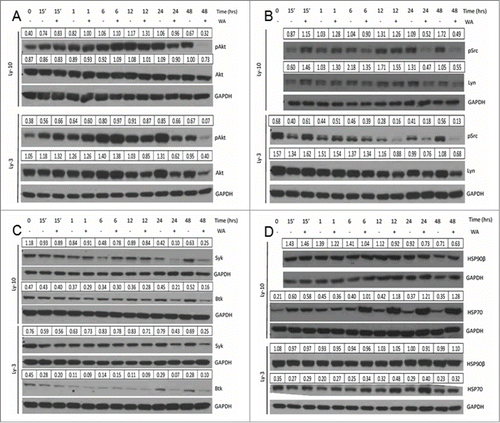
Figure 5. Effect of WA treatment on the pro-survival factors of B cell lymphomas; all client proteins of Hsp90. (A) LY-10 and LY-3 lymphoma cells were treated with 2.5 µM WA for varying time points or the appropriate volume of DMSO vehicle. Cells were harvested and total protein was isolated. Western blots of lysates were first probed for pAkt (Ser473), stripped and then for total Akt. (B) LY-10 and LY-3 cells treated with 2.5 µM WA were first probed for phosphorylated-SFK with pSrc (Y416) antibody and then probed for total Lyn, an SFK. (C) LY-10 and LY-3 cell lysates were probed for total protein levels of Syk and Btk. (D) LY-10 and LY-3 cells treated with 2.5 µM WA were probed for total expression of Hsp90β and Hsp70. Densitometry values for total protein were normalized to corresponding GAPDH band, whereas the phosphoprotein values were normalized to the corresponding total protein.

Figure 6. Withaferin A inhibits B cell lymphoma growth in vivo. (A) WA significantly inhibited the subcutaneous tumor growth of A20-Luc, a murine B cell lymphoma. Tumor size was measured through bioluminescence imaging. Images show growth of tumor at Day 13 comparing the vehicle treated animals (bottom) and WA treated animals (top). The numbers below the images refer to mouse tags. (B) Histogram depicts the average growth of tumor over time comparing the vehicle and drug treatments. Size of tumor is measured in photons/sec/cm2. Error bars represent standard error of the mean per group at each day of measurement. (C) Tumors were excised on Day 15 of the study and the percentage of CD19+YFP+ cells were measured by flow cytometry and compared between vehicle and WA treated groups.
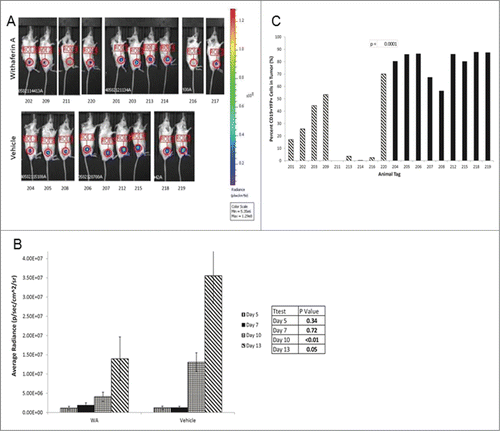
Figure 6. Withaferin A inhibits B cell lymphoma growth in vivo. (A) WA significantly inhibited the subcutaneous tumor growth of A20-Luc, a murine B cell lymphoma. Tumor size was measured through bioluminescence imaging. Images show growth of tumor at Day 13 comparing the vehicle treated animals (bottom) and WA treated animals (top). The numbers below the images refer to mouse tags. (B) Histogram depicts the average growth of tumor over time comparing the vehicle and drug treatments. Size of tumor is measured in photons/sec/cm2. Error bars represent standard error of the mean per group at each day of measurement. (C) Tumors were excised on Day 15 of the study and the percentage of CD19+YFP+ cells were measured by flow cytometry and compared between vehicle and WA treated groups.
Supplemental material

Supplemental Figures

Download MS Word (1.4 MB)

Reprints and Corporate Permissions

Please note: Selecting permissions does not provide access to the full text of the article, please see our help page How do I view content?

To request a reprint or corporate permissions for this article, please click on the relevant link below:

Academic Permissions

Please note: Selecting permissions does not provide access to the full text of the article, please see our help page How do I view content?

Obtain permissions instantly via Rightslink by clicking on the button below:

If you are unable to obtain permissions via Rightslink, please complete and submit this Permissions form. For more information, please visit our Permissions help page.