2,281
Views
33
CrossRef citations to date
0
Altmetric
Research Paper

NDRG1 overexpression promotes the progression of esophageal squamous cell carcinoma through modulating Wnt signaling pathway

, , , , , , , & show all
Pages 943-954 | Received 02 Mar 2016, Accepted 03 Jul 2016, Published online: 22 Aug 2016

Figures & data

Figure 1. NDRG1 overexpression was correlated with poor overall survival in esophageal cancer. (A) Expression of NDRG1 was analyzed by immunohistochemical analysis in TMAs containing 78 ESCC tumor and adjacent normal epithelial tissues, with duplicate cores used for each case. The majority of tumor areas strongly express NDRG1 in the cytoplasm. Magnification, 200×. (B) Kaplan-Meier curve combined with Log-rank analysis for patients with ESCC showing weak and strong NDRG1 expression. (C) NDRG1 expression in a subset of ESCC (T) and matched non-neoplastic surgical tissues (N) was analyzed by Western blot analysis. (D) Whole cell protein extracts from 9 esophageal cancer cell lines were subjected to protein gel blot analysis using antibodies against NDRG1. Quantitative values of relative NDRG1 levels were normalized to β-actin (mean ± SD).
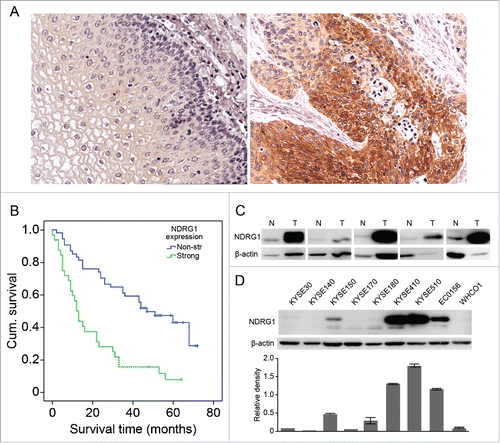
Figure 1. NDRG1 overexpression was correlated with poor overall survival in esophageal cancer. (A) Expression of NDRG1 was analyzed by immunohistochemical analysis in TMAs containing 78 ESCC tumor and adjacent normal epithelial tissues, with duplicate cores used for each case. The majority of tumor areas strongly express NDRG1 in the cytoplasm. Magnification, 200×. (B) Kaplan-Meier curve combined with Log-rank analysis for patients with ESCC showing weak and strong NDRG1 expression. (C) NDRG1 expression in a subset of ESCC (T) and matched non-neoplastic surgical tissues (N) was analyzed by Western blot analysis. (D) Whole cell protein extracts from 9 esophageal cancer cell lines were subjected to protein gel blot analysis using antibodies against NDRG1. Quantitative values of relative NDRG1 levels were normalized to β-actin (mean ± SD).

Table 1. Correlation between NDRG1 expression and clinical parameters.

Figure 2. NDRG1 overexpression induces the epithelial mesenchymal transition in esophageal cancer cells. (A) The effect of NDRG1 exogenous expression was analyzed by western blot analysis. Quantitative values of relative NDRG1 levels were normalized to β-actin (mean ± SD). (B) The morphological changes of esophageal cancer cells overexpressed NDRG1. Image at 200x, 20 µm. (C) Whole cell protein extracts from KYSE 30-NDRG1 and KYSE 30-Ctrl cells were subjected to protein gel blot analysis using antibodies against NDRG1, E-cadherin, N-cadherin, Snail and MMP1. Quantitative values of relative protein levels were normalized to actin (mean ± SD). ((D)& E), Relative expression levels of genes associated with angiogenesis, metastasis, adhesion, the cell cycle and the Wnt pathway in KYSE 30 cells overexpressed NDRG1 (KYSE 30-NDRG1) compared with those of mock cells (KYS E30-Ctrl); results are based on analysis in real-time PCR arrays. (F) The mRNA levels of MMP1, MTSS1 and CDH2 were validated in both KYSE 30-NDRG1 and KYSE 30-Ctrl cells by RT-PCR. KYSE 30-NDRG1, NDRG1 overexpression KYSE 30 cells; KYSE 30-Ctrl, KYSE 30 cells transfected with vector control.
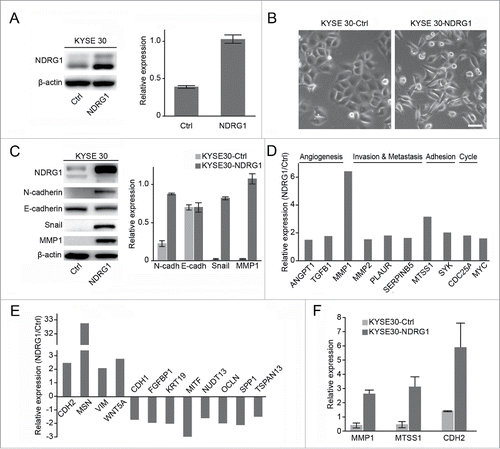
Figure 2. NDRG1 overexpression induces the epithelial mesenchymal transition in esophageal cancer cells. (A) The effect of NDRG1 exogenous expression was analyzed by western blot analysis. Quantitative values of relative NDRG1 levels were normalized to β-actin (mean ± SD). (B) The morphological changes of esophageal cancer cells overexpressed NDRG1. Image at 200x, 20 µm. (C) Whole cell protein extracts from KYSE 30-NDRG1 and KYSE 30-Ctrl cells were subjected to protein gel blot analysis using antibodies against NDRG1, E-cadherin, N-cadherin, Snail and MMP1. Quantitative values of relative protein levels were normalized to actin (mean ± SD). ((D)& E), Relative expression levels of genes associated with angiogenesis, metastasis, adhesion, the cell cycle and the Wnt pathway in KYSE 30 cells overexpressed NDRG1 (KYSE 30-NDRG1) compared with those of mock cells (KYS E30-Ctrl); results are based on analysis in real-time PCR arrays. (F) The mRNA levels of MMP1, MTSS1 and CDH2 were validated in both KYSE 30-NDRG1 and KYSE 30-Ctrl cells by RT-PCR. KYSE 30-NDRG1, NDRG1 overexpression KYSE 30 cells; KYSE 30-Ctrl, KYSE 30 cells transfected with vector control.

Figure 3. NDRG1 impacts the Wnt pathway via TLE2 and β-catenin in esophageal cancer cells. (A) Relative gene expression levels of FZD8, TLE2, LEF, and WNT3A were analyzed in KYSE 30 cells overexpressed NDRG1 (KYSE 30-NDRG1) compared with those in mock cells (KYSE 30-Ctrl) using real-time PCR arrays. (B) mRNA levels of Wnt pathway-associated genes in NDRG1 knock-down cells (KYSE 30-shNDRG1, shNDRG1) were assessed by quantitative RT-PCR and compared with mock cells (KYSE 30-vec, vec). (C) Protein levels of NDRG1, TLE2 and β-catenin from KYSE 30-NDRG1 and KYSE 30-Ctrl cells were measured by Western blot. (D) Quantitative RT-PCR results validated the mRNA levels of the TLE2 in KYSE 30-NDRG1 and NDRG1 knock-down (KYSE 30-shNDRG1) cells. (E) The colocalization of NDRG1 and TLE2 was analyzed by confocal microscopy in KYSE 30-NDRG1 and KYSE 30-Ctrl cells. TLE2 was mainly localized in the nuclei, while NDRG1 was expressed in both the nuclei and cytoplasma. NDRG1 and TLE2 colocalized in the nuclei.Green fluorescence, TLE2; red fluorescence, NDRG1; blue fluorescence, nuclei stained with DAPI. Scale bar, 10 μm. (F) Cytosolic and nuclear proteins were isolated from KYSE 30-NDRG1 and KYSE 30-Ctrl cells, and NDRG1, β-catenin and TLE2 expression was analyzed by western blot. Lamin B, nuclear marker; β-actin, cytoplasmic marker.
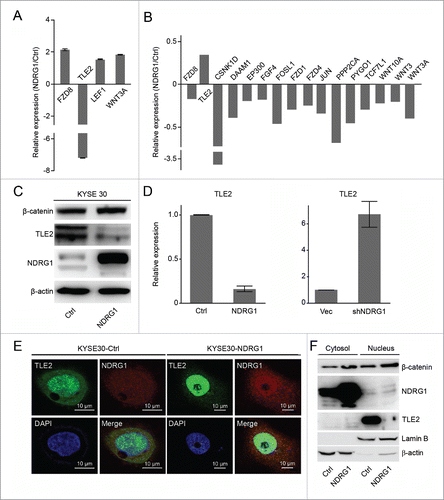
Figure 3. NDRG1 impacts the Wnt pathway via TLE2 and β-catenin in esophageal cancer cells. (A) Relative gene expression levels of FZD8, TLE2, LEF, and WNT3A were analyzed in KYSE 30 cells overexpressed NDRG1 (KYSE 30-NDRG1) compared with those in mock cells (KYSE 30-Ctrl) using real-time PCR arrays. (B) mRNA levels of Wnt pathway-associated genes in NDRG1 knock-down cells (KYSE 30-shNDRG1, shNDRG1) were assessed by quantitative RT-PCR and compared with mock cells (KYSE 30-vec, vec). (C) Protein levels of NDRG1, TLE2 and β-catenin from KYSE 30-NDRG1 and KYSE 30-Ctrl cells were measured by Western blot. (D) Quantitative RT-PCR results validated the mRNA levels of the TLE2 in KYSE 30-NDRG1 and NDRG1 knock-down (KYSE 30-shNDRG1) cells. (E) The colocalization of NDRG1 and TLE2 was analyzed by confocal microscopy in KYSE 30-NDRG1 and KYSE 30-Ctrl cells. TLE2 was mainly localized in the nuclei, while NDRG1 was expressed in both the nuclei and cytoplasma. NDRG1 and TLE2 colocalized in the nuclei.Green fluorescence, TLE2; red fluorescence, NDRG1; blue fluorescence, nuclei stained with DAPI. Scale bar, 10 μm. (F) Cytosolic and nuclear proteins were isolated from KYSE 30-NDRG1 and KYSE 30-Ctrl cells, and NDRG1, β-catenin and TLE2 expression was analyzed by western blot. Lamin B, nuclear marker; β-actin, cytoplasmic marker.

Figure 4. Alteration of NDRG1 expression affected TLE2 and EMT associated genes. (A) Comparison of protein expression levels of NDRG1 and TLE2 by protein gel blot analysis of total cell lysates in KYSE 30 overexpression (KYSE 30-NDRG1) and knock-down (KYSE 30-shNDRG1) esophageal cancer cells. (B) NDRG1 interacts with β-catenin and TLE2. NDRG1 was immunoprecipitated using an anti-NDKRG1 antibody. NDRG1, β-catenin and TLE2 were detected by western blot analysis. WCL, whole cell lysis; IP, immunoprecipitation; β-actin was a loading control. (C) The mRNA levels of the NDRG1 and TLE2 genes following transient transfection of HEK293 cells with NDRG1 were validated by quantitative real-time PCR. (D) Relative gene expression levels of SNAIL, TWIST1, ZEB1 and FOXC2 were analyzed by real-time PCR in transiently transfected mock (KYSE 30-Ctrl), NDRG1 (KYSE 30-NDRG1) and NDRG1 with TLE2 KYSE 30 cells. (E) The EMT-associated genes were measured by real-time PCR following the transient transfection of HEK293 cells with NDRG1 (HEK293-NDRG1), TLE2 (HEK293-TLE2) and vector alone (HEK293-Ctrl).
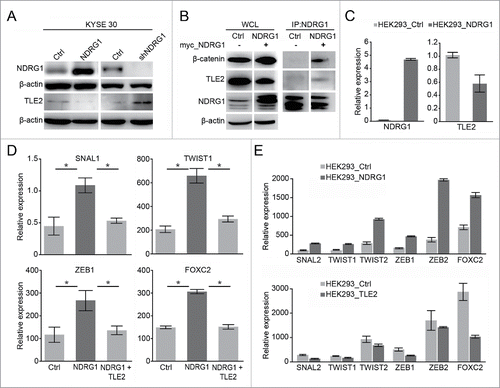
Figure 4. Alteration of NDRG1 expression affected TLE2 and EMT associated genes. (A) Comparison of protein expression levels of NDRG1 and TLE2 by protein gel blot analysis of total cell lysates in KYSE 30 overexpression (KYSE 30-NDRG1) and knock-down (KYSE 30-shNDRG1) esophageal cancer cells. (B) NDRG1 interacts with β-catenin and TLE2. NDRG1 was immunoprecipitated using an anti-NDKRG1 antibody. NDRG1, β-catenin and TLE2 were detected by western blot analysis. WCL, whole cell lysis; IP, immunoprecipitation; β-actin was a loading control. (C) The mRNA levels of the NDRG1 and TLE2 genes following transient transfection of HEK293 cells with NDRG1 were validated by quantitative real-time PCR. (D) Relative gene expression levels of SNAIL, TWIST1, ZEB1 and FOXC2 were analyzed by real-time PCR in transiently transfected mock (KYSE 30-Ctrl), NDRG1 (KYSE 30-NDRG1) and NDRG1 with TLE2 KYSE 30 cells. (E) The EMT-associated genes were measured by real-time PCR following the transient transfection of HEK293 cells with NDRG1 (HEK293-NDRG1), TLE2 (HEK293-TLE2) and vector alone (HEK293-Ctrl).

Figure 5. Ectopic overexpression of NDRG1 promotes tumor growth in vivo. (A) Tumor volume was measured every 2 to 3 d after subcutaneous inoculation with 5×10⁶ cells/animal. KYSE 30 cells overexpressing NDRG1 (KYSE 30-NDRG1) enhanced the growth of the xenograft tumors compared with that of inoculations using parent cells (P < 0.001). (B) Photographs of the dissected xenografts using the same magnification scale. (C) Xenograft tissue was subjected to immunohistochemical analysis for NDRG1, MMP1, Ki67, β-catenin, TLE2 and E-cadherin, Scale bar, 100 μm.
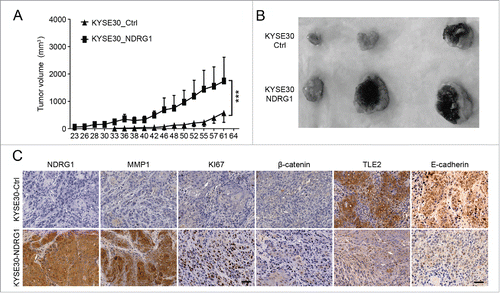
Figure 5. Ectopic overexpression of NDRG1 promotes tumor growth in vivo. (A) Tumor volume was measured every 2 to 3 d after subcutaneous inoculation with 5×10⁶ cells/animal. KYSE 30 cells overexpressing NDRG1 (KYSE 30-NDRG1) enhanced the growth of the xenograft tumors compared with that of inoculations using parent cells (P < 0.001). (B) Photographs of the dissected xenografts using the same magnification scale. (C) Xenograft tissue was subjected to immunohistochemical analysis for NDRG1, MMP1, Ki67, β-catenin, TLE2 and E-cadherin, Scale bar, 100 μm.

Figure 6. Illustration showing the mechanism by which NDRG1 mediates activation of the Wnt signaling pathway. Overexpression of NDRG1 results in decreased TLE2 expression and increased β-catenin levels, which may then switch to β-catenin/TCF complex assembly and initiation of Wnt signaling pathway activation, promoting EMT in esophageal tumor cells.
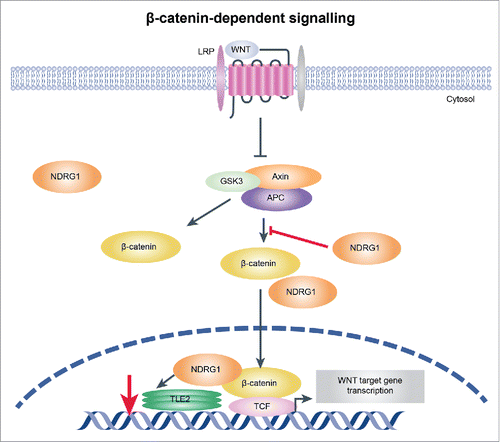
Figure 6. Illustration showing the mechanism by which NDRG1 mediates activation of the Wnt signaling pathway. Overexpression of NDRG1 results in decreased TLE2 expression and increased β-catenin levels, which may then switch to β-catenin/TCF complex assembly and initiation of Wnt signaling pathway activation, promoting EMT in esophageal tumor cells.
Supplemental material

Supplementary_Tables_1-4.pdf

Download PDF (123.9 KB)