Figures & data
Figure 1. Combination of PD with CP effectively inhibits colony formation of HCC cells.
The indicated cell lines were seeded into six-well culture plates at a desired density. Then, the cells were treated with PD, CP or their concurrent combination the next day. After 2 weeks, the plates were stained for the formation of cell colonies with crystal violet dye in methanol. The photograph of one well in a representative experiment is shown for each treatment in the colony formation assay. (A) PLC/PRF/5 cells (p53-RS); (B) HepG2 cells (wild-type p53); (C) Hep3B cells (p53 null); (D) Hep3B cells (p53-RS).
Figure 2. The quantification of the results from the HCC colony formation assays.
The indicated cells were treated with PD and CP either alone or in combination treatment as described in legends. Values represent the mean±SD (n = 3, * P < .05; n.s. P> .05). (A) PLC/PRF/5 cells (p53-RS); (B) HepG2 cells (wild-type p53); (C) Hep3B cells (p53 null); (D) Hep3B cells (p53-RS).
Table 1. Synergetic effect of PD and CP combination on HCC growth as analyzed by using Jin′s formula*.
Figure 3. Analysis of cell survival using the IncuCyte ZOOM system.
The indicated cell lines were seeded in 96-well plates at a given density. The growth of the human HCC cells treated with PD and CP alone or in combination was measured for 5 days using the IncuCyte Live Cell Imaging system that monitors cell confluency in real time. The growth curves for these cells are plotted as the mean±SD confluence from n = 5 wells in an experiment representative of the three independent experiments. (A) PLC/PRF/5 cells (p53-RS); (B) HepG2 cells (wild-type p53); (C) Hep3B cells (p53 null); (D) Hep3B cells (p53-RS).
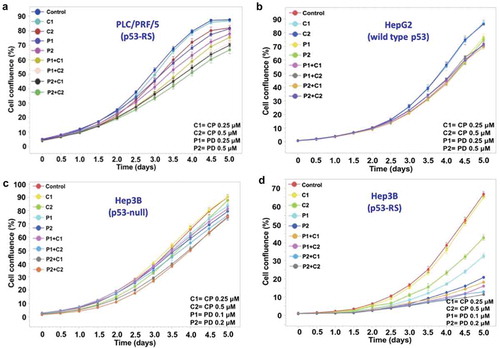
Figure 4. Combination of PD with CP more significantly inhibits proliferation and survival of HCC cells that harbor p53-RS.
Cell growth of HCC cells treated with PD or CP alone or in combination was monitored as indicated in legends with the IncuCyte Live Cell Imaging system. Mean±SD confluence at the fifth day in the analysis of cell confluence (n = 5, * P < .05). (A) PLC/PRF/5 cells (p53-RS); (B) HepG2 cells (wild-type p53); (C) Hep3B cells (p53 null); (D) Hep3B cells (p53-RS).
Figure 5. Combination with low doses of PD and CP shows a significant synergy on c-Myc reduction with elevated p53 activity in a p53-RS-dependent manner.
The indicated cell lines were plated in 6-well culture plates and treated with PD or CP alone or in combination at the indicated doses for 18 h. The cells were then harvested for preparation of whole cell lysates and subsequent Western blot analysis with antibodies for c-Myc, p53, and p21, respectively. Protein (30 μg) was loaded in each lane, and an anti-β-actin antibody was used to be a loading control. (A) PLC/PRF/5 cells (p53-RS); (B) HepG2 cells (wild-type p53); (C) Hep3B cells (p53 null); (D) Hep3B cells (p53-RS).
Figure 6. Combination of PD with CP more significantly suppresses the expression of c-Myc target genes at RNA levels.
Cells as indicated below were treated with either PD or CP alone or in combination for 16 h and harvested for RNA extraction and q-PCR analyses for specific c-Myc target genes as indicated in the figure. GAPDH was used as negative control. Three independent experiments were performed in duplicates. Differences between the combination treatment and PD or CP alone for each target were analyzed using either Student’s t-tests (comparisons between two groups) or ANOVA (statistical analysis for 3 groups) (n = 3, * P < .05; n.s. P> .05). (A) PLC/PRF/5 cells (p53-RS); (B) HepG2 cells (wild-type p53); (C) Hep3B cells (p53 null); (D) Hep3B cells (p53-RS).
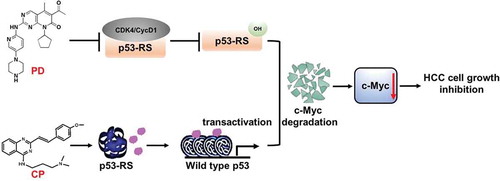
Figure 7. The model for the mechanisms underlying the p53-RS-dependent synergistic antitumor effect of PD and CP in combination.
As a CDK4 inhibitor, PD inhibits the phosphorylation of p53-RS by CDK4/Cyclin D1 as previously shown.Citation21 In doing so, this inhibitor can overcome the activation of c-Mcy by p53-RS via promoting its degradation. Also, the mutant p53 converter compound CP rescues native conformation and transcriptional transactivation activity of p53-RS. The sum outcome of the co-treatment of p53-RS-bearing HCC cells with the two compounds is the more significant reduction of c-Myc level and activity, consequently suppressing HCC cell proliferation and growth in a p53-RS-dependent manner.