Figures & data
Figure 1. ONC201 induces potent anti-proliferative and apoptotic effects across multiple pancreatic cancer cell lines. A) Clonogenicity assays of AsPC-1, BxPC3, HPAFII, and PANC-1 cell lines after treatment with ONC201. Cells were pre-treated for 3 days and grown in drug-free media for 7 days after. B) Quantification of clonogenicity assays shown in Figure 1a. C) Sub-G1 analysis of various pancreatic cancer cells treated with ONC201 for 72 hours. D) Time-course western blot of AsPC-1 cells treated with ONC201 for 12, 24, 48, or 72 hours at 3 μM (+) or 6 μM (++). Quantification of western blot is displayed below. * p < .05, ** p < .01, ** p < .001
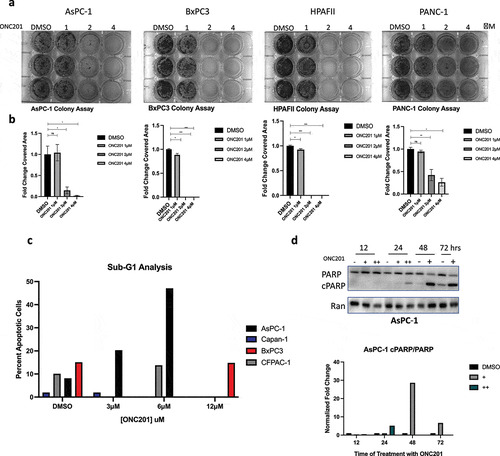
Figure 2. ONC201 induces potent activation of the integrated stress response in a panel of pancreatic tumor cell lines. A) Time-course western blot of HPAFII cells treated with ONC201 (+, 3 μM; ++, 6 μM) for 24, 48, or 72 hours. B) Time-course western blot of AsPC-1 cells treated with ONC201 (+, 3 μM) showing ATF4 upregulation at 48 and 72 hours. Time-course western blot of CFPAC-1 Cells treated with ONC201 (+, 6 μM; ++, 12 μM) D) Time-course western blot assessing DR5 expression in BxPC3 cells after treatment with ONC201 for 48 and 72 hours (+, 12 μM; ++, 20 μM). Quantification of all blots is shown
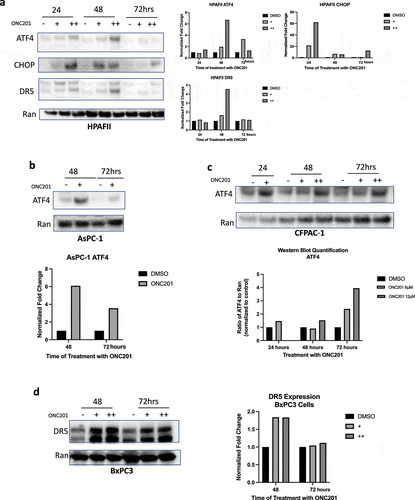
Figure 3. ONC201 primes pancreatic tumor cell lines for TRAIL-induced apoptosis through downregulation of key anti-apoptotic proteins. A) Western blots in AsPC-1 cell lines treated with ONC201 (+, 3 μM) B) HPAFII cells treated with ONC201 (+, 3 μM; ++, 6 μM). C) BxPC3 cells treated with ONC201 for 72 hours (+, 12 μM)
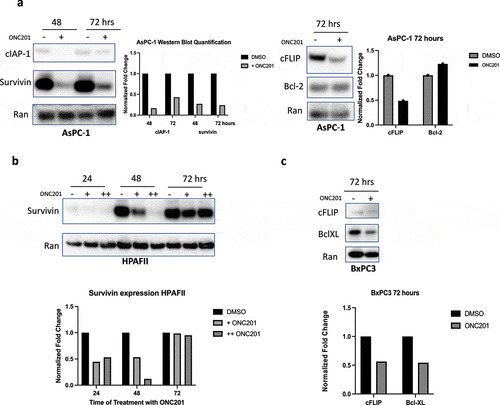
Figure 4. Combination of ONC201 and TRAIL receptor agonists induces synergistic apoptosis across PDAC tumor cell lines in vitro. A) Cell viability assay of PANC-1 cells treated with varying doses of ONC201 and rhTRAIL. Cells were pre-treated with ONC201 for 72 hours. rhTRAIL was added for 4 hours before imaging. B) Dose response curve for image shown in Panel 4A. C) Heat map of PANC-1 cells treated with ONC201 and TLY012. The color of the wells represents fraction alive according to the scale bar. Combination index values are listed inside the wells. Values less than 1 indicate synergy. C) Combination indices for PDAC tumor cell lines pre-treated with ONC201 for 72 hours and TLY012 for 4 hours
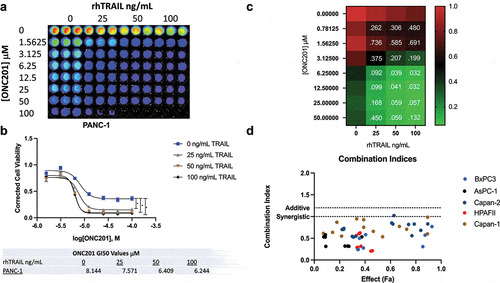
Figure 5. Combination of ONC201 and TRAIL induces selective, synergistic apoptosis across multiple PDAC tumor cell line in vitro with minimal toxicity to non-transformed cells. A) PARP cleavage western blots of HPAFII, BxPC3, and Capan-1 cells after 72 hours treatment with ONC201 (3 μM, 12 μM, or 6 μM, respectively) and 4 hours treatment with either 50 or 100 ng/mL rhTRAIL. B) PARP cleavage western blot of PANC-1 cells treated with 1 μM ONC201 for 72 hours. TLY012 subsequently added for 4 hours. C) CellTiter Glo assay assessing cell viability of non-transformed HFF-1 cells treated with ONC201 for 72 hours and subsequent addition of TLY012 for 4 hours. D) PARP cleavage western blot of HFF-1 cells treated with 2 μM ONC201 for 72 hours and of TLY012 for 4 hours
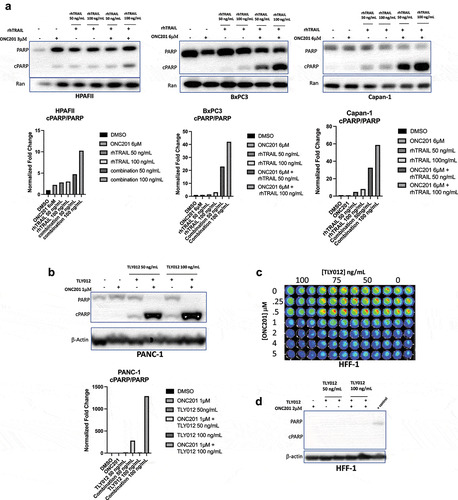
Figure 6. Combination of ONC201 and TLY012 significantly slows PDAC tumor growth in HPAFII and BxPC3 tumor models in vivo. A) Mice bearing HPAFII xenograft tumors were treated with two doses of the combination of ONC201 and TLY012. ONC201 (100 mg/kg) was administered first and TLY012 (2 mg/kg) was injected three days later. The second dose was initiated one week after initial treatment with ONC201. Treatment was initiated once tumors reached the optimal size of 100–150 mm3. Vehicle (n = 5), ONC201 (n = 5), TLY012 (n = 6), Combination (n = 8). B) Mice bearing BxPC3 xenograft tumors were treated with three doses of the combination of ONC201 and TLY1012. ONC201 (100 mg/kg) was administered first and TLY012 (2 mg/kg) was injected three days later. Mice were dosed once per week with the combination treatment. To combat heterogeneity in tumor formation, mice were dosed in a ‘rolling format’ and separated into two cohorts, allowing tumors to reach the optimal size of ~150mm3 before treatment. Vehicle (n = 4), ONC201 (n = 5), TLY012 (n = 5), Combination (n = 5). C) H&E liver sections from mice bearing HPAFII xenografts. Mice were treated with three, weekly doses ONC201 (100 mg/kg) and TLY012 (2 mg/kg). D) Mouse weights from mice bearing BxPC3. Mice were dosed with three, weekly doses of ONC201 (100 mg/kg) and TLY012 (2 mg/kg). * p < .05, ** p < .01
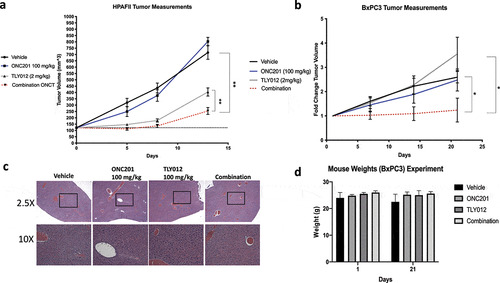
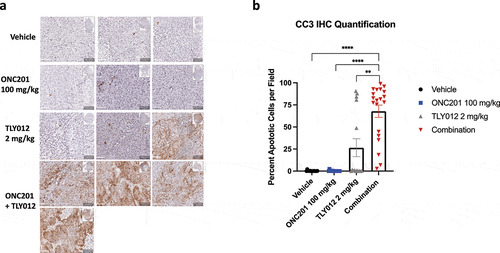
Figure 7. Combination of ONC201 and TLY012 induces potent apoptosis in an HPAFII tumor model in vivo. A) Immunohistochemical analysis of cleaved caspase 3 (CC3) in HPAFII tumor xenograft models treated with three, once weekly doses of ONC201 (100 mg/kg) and TLY012 (2 mg/kg). ONC201 was administered first, and TLY012 was administered 3 days later. Each dose of the combination was administered one week apart. Treatment was initiated once tumors reached between 100–150mm3. Mice were euthanized 1 day after administration of the third dose of TLY012. All scale bars indicate 50 μM. B) Graph showing quantification of 5 20X fields per tumor. * p < .05, ** p < .01, *** p < .001, **** p < . 0001