5,598
Views
13
CrossRef citations to date
0
Altmetric
Research Paper

Trojan horse treatment based on PEG-coated extracellular vesicles to deliver doxorubicin to melanoma in vitro and in vivo

, , , , , , , , , ORCID Icon, , , , , , , , & show all
Pages 1-16 | Received 21 Jun 2021, Accepted 03 Nov 2021, Published online: 29 Dec 2021

Figures & data

Figure 1. (a) Elution graphic obtained after gel-filtration through the Sepharose 200-HR column. The graph is showing the absorption values at 280 nm for each fraction. Dark circles indicate the fractions that were further selected for the enrichment and characterization of nanosized EVs. (b) Western blot analysis for different EV markers in EV-enriched pooled fractions compared to parent cells. The Western blot figure shows results for CD9 and TSG101 as markers highlighting EV presence. Cytochrome c was used as a negative marker for EVs and β-actin was included as a loading control. MW (kDa) – the molecular weight of the proteins in kDa.
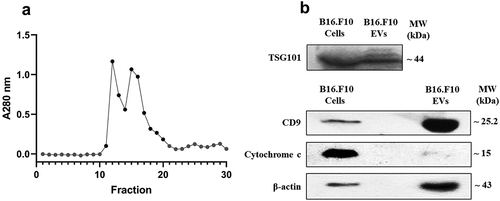
Figure 1. (a) Elution graphic obtained after gel-filtration through the Sepharose 200-HR column. The graph is showing the absorption values at 280 nm for each fraction. Dark circles indicate the fractions that were further selected for the enrichment and characterization of nanosized EVs. (b) Western blot analysis for different EV markers in EV-enriched pooled fractions compared to parent cells. The Western blot figure shows results for CD9 and TSG101 as markers highlighting EV presence. Cytochrome c was used as a negative marker for EVs and β-actin was included as a loading control. MW (kDa) – the molecular weight of the proteins in kDa.

Figure 2. Transmission electron microscopy (TEM) of metabolic stress condition B16.F10 melanoma cells-derived nanosized EVs isolated through the UF-SEC technique. Exosomes were negatively stained with uranyl acetate. Dark arrows indicate the EVs, imaged as ‚cup-shaped’ structures with sizes averaging 60 nm. A – 1000 nm scale bar; B – 500 nm scale bar; C – 200 nm scale bar; D – 100 nm scale bar.
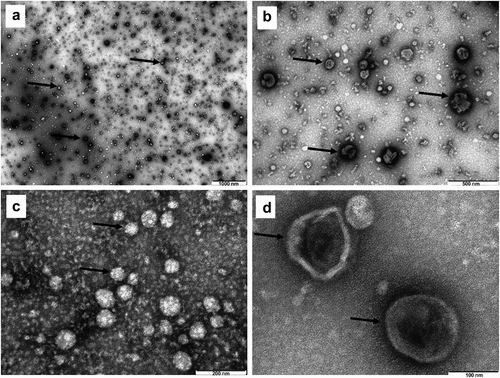
Figure 2. Transmission electron microscopy (TEM) of metabolic stress condition B16.F10 melanoma cells-derived nanosized EVs isolated through the UF-SEC technique. Exosomes were negatively stained with uranyl acetate. Dark arrows indicate the EVs, imaged as ‚cup-shaped’ structures with sizes averaging 60 nm. A – 1000 nm scale bar; B – 500 nm scale bar; C – 200 nm scale bar; D – 100 nm scale bar.

Figure 3. Spectrofluorimetric assessment of functionalized EVs (PEG-EVs) uptake by B16.F10 cells compared to natural (EV) or artificial vehicle uptake (LCL). Uptake studies were performed after 4 h incubation of B16.F10 cells with a concentration of 7.25 μM phospholipids of rhodamine (excitation at 540 nm, emission at 580 nm) fluorescently labeled long-circulating liposomes (LCL-Rhod), Cell Tracker Deep Red Dye-LabeleD EVs (EV-CTDR), and PEG functionalized EVs labeled with CTDR (excitation at 640 nm, emission at 680 nm). Results were expressed as mean ± SD of triplicate measurements and represented as Relative Fluorescence Units (RFU). Untreated B16.F10 cells were used to correct for cell autofluorescence; ns – not significant; P > .05; *, P < .05.
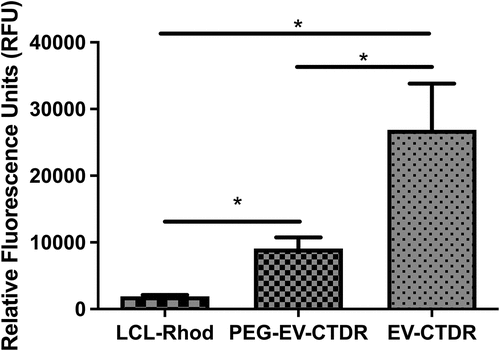
Figure 3. Spectrofluorimetric assessment of functionalized EVs (PEG-EVs) uptake by B16.F10 cells compared to natural (EV) or artificial vehicle uptake (LCL). Uptake studies were performed after 4 h incubation of B16.F10 cells with a concentration of 7.25 μM phospholipids of rhodamine (excitation at 540 nm, emission at 580 nm) fluorescently labeled long-circulating liposomes (LCL-Rhod), Cell Tracker Deep Red Dye-LabeleD EVs (EV-CTDR), and PEG functionalized EVs labeled with CTDR (excitation at 640 nm, emission at 680 nm). Results were expressed as mean ± SD of triplicate measurements and represented as Relative Fluorescence Units (RFU). Untreated B16.F10 cells were used to correct for cell autofluorescence; ns – not significant; P > .05; *, P < .05.

Figure 4. Global characterization of EVs enriched by UF-SEC that were detected by Mass spectrometry and bioinformatic analysis of EV membrane proteins. (a) Venn diagram showing the intersection of EVs released by B16.F10 murine melanoma cells subjected to metabolic stress (1% FBS) with the compendium of proteins detected in other studies involving EV research for the target species (ExoCarta, EVpedia, and Vesiclepedia); B16.F10 EVs = proteomic data from the current study. The diagram was obtained using the FunRich tool (http://www.funrich.org/). (b) Venn diagram showing the intersection of membrane proteins of B16.F10 EVs compared to membrane proteins of parent murine melanoma cells subjected to metabolic stress (1% FBS). Functional enrichment for the most frequently identified (27) membrane proteins from this study by Gene Ontology. Graphs represent the assigned classification of (c) the reactome pathway and (d) molecular function. Data were analyzed and represented using FunRich (http://funrich.org/download) tool.
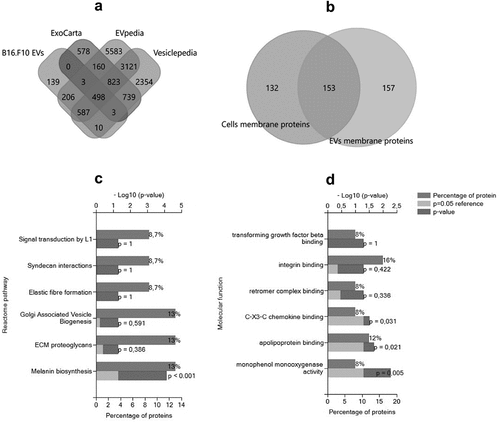
Figure 4. Global characterization of EVs enriched by UF-SEC that were detected by Mass spectrometry and bioinformatic analysis of EV membrane proteins. (a) Venn diagram showing the intersection of EVs released by B16.F10 murine melanoma cells subjected to metabolic stress (1% FBS) with the compendium of proteins detected in other studies involving EV research for the target species (ExoCarta, EVpedia, and Vesiclepedia); B16.F10 EVs = proteomic data from the current study. The diagram was obtained using the FunRich tool (http://www.funrich.org/). (b) Venn diagram showing the intersection of membrane proteins of B16.F10 EVs compared to membrane proteins of parent murine melanoma cells subjected to metabolic stress (1% FBS). Functional enrichment for the most frequently identified (27) membrane proteins from this study by Gene Ontology. Graphs represent the assigned classification of (c) the reactome pathway and (d) molecular function. Data were analyzed and represented using FunRich (http://funrich.org/download) tool.

Table 1. Membrane proteins involved in EV internalization and intercellular signaling processes

Table 2. Determined IC50 values of DOX after 24 h treatment with PEG-EV-DOX or free DOX on B16.F10 cells in monoculture and in co-culture with M2 TAM

Figure 5. Anti-proliferative effects of PEG-EV-DOX and DOX on B16.F10 cells in monoculture and co-culture with M2 TAM. (a) after 24 h incubation of B16.F10 cells in monoculture with different concentrations of PEG-EV-DOX and DOX; (b) after 24 h incubation of B16.F10 cells in co-culture with M2 TAM with different concentrations of PEG-EV-DOX and DOX. Data represent mean ± SD of triplicate measurements. The unpaired t test was used to compare the effects of PEG-EV-DOX treatment to the effects of the same concentration of free DOX; ns – not significant; P > .05; *, P < .05; **, P < .01; ***, P < .001.
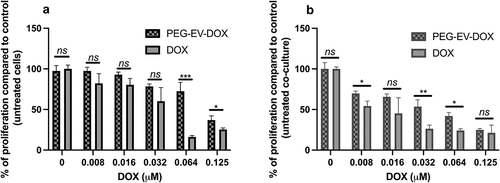
Figure 5. Anti-proliferative effects of PEG-EV-DOX and DOX on B16.F10 cells in monoculture and co-culture with M2 TAM. (a) after 24 h incubation of B16.F10 cells in monoculture with different concentrations of PEG-EV-DOX and DOX; (b) after 24 h incubation of B16.F10 cells in co-culture with M2 TAM with different concentrations of PEG-EV-DOX and DOX. Data represent mean ± SD of triplicate measurements. The unpaired t test was used to compare the effects of PEG-EV-DOX treatment to the effects of the same concentration of free DOX; ns – not significant; P > .05; *, P < .05; **, P < .01; ***, P < .001.

Figure 6. Antitumor effects of PEG-EV-DOX therapy on B16.F10 melanoma in vivo. For each experimental group, a dose of 2 mg/kg DOX was administered at days 8 and 11 after s.c. tumor cell inoculation, either as free drug (DOX), via artificial drug delivery vehicles (LCL-DOX) or via stabilized natural drug delivery particles (PEG-EV-DOX). Tumor volumes at sacrification day (12) were represented as mean ± SD of tumor volumes of five mice and were compared with control group (untreated tumors) or with the other experimental groups. ns – not significant; P > .05; *, P < .05; **, P < .01; ***, P < .001.
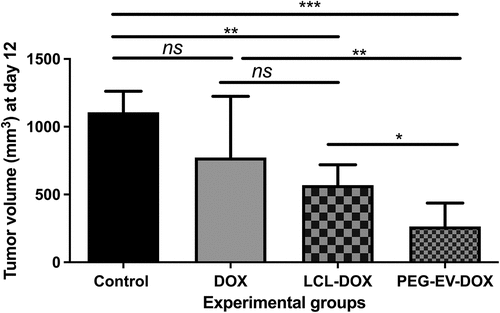
Figure 6. Antitumor effects of PEG-EV-DOX therapy on B16.F10 melanoma in vivo. For each experimental group, a dose of 2 mg/kg DOX was administered at days 8 and 11 after s.c. tumor cell inoculation, either as free drug (DOX), via artificial drug delivery vehicles (LCL-DOX) or via stabilized natural drug delivery particles (PEG-EV-DOX). Tumor volumes at sacrification day (12) were represented as mean ± SD of tumor volumes of five mice and were compared with control group (untreated tumors) or with the other experimental groups. ns – not significant; P > .05; *, P < .05; **, P < .01; ***, P < .001.

Figure 7. The effects of PEG-EV-DOX treatment on the intratumor production or activation of proteins associated with apoptosis (BAX, Bcl-xL), proliferation (c-Jun), and inflammation and angiogenesis (NF-κB p65). Cropped Western blot images and their representative graphs displaying the intratumor levels of proteins at day 12 when mice were sacrificed show the (a) pro-apoptotic BAX/ anti-apoptotic Bcl-xL ratio from samples run on the same blot; (b) The percentage of p-NF-κB p65 levels from total NF-κB p65 protein levels; (c) The percentage of AP-1 p-c-Jun activation from total AP-1 c-Jun protein levels; β-actin was used as loading control. The results were expressed as mean ± SD of two independent measurements; unpaired t-test was used for statistical analysis of the data; ns – not significant; P > .05; *, P < .05; **, P < .01; ***, P < .001.
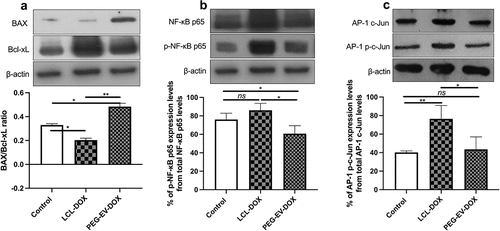
Figure 7. The effects of PEG-EV-DOX treatment on the intratumor production or activation of proteins associated with apoptosis (BAX, Bcl-xL), proliferation (c-Jun), and inflammation and angiogenesis (NF-κB p65). Cropped Western blot images and their representative graphs displaying the intratumor levels of proteins at day 12 when mice were sacrificed show the (a) pro-apoptotic BAX/ anti-apoptotic Bcl-xL ratio from samples run on the same blot; (b) The percentage of p-NF-κB p65 levels from total NF-κB p65 protein levels; (c) The percentage of AP-1 p-c-Jun activation from total AP-1 c-Jun protein levels; β-actin was used as loading control. The results were expressed as mean ± SD of two independent measurements; unpaired t-test was used for statistical analysis of the data; ns – not significant; P > .05; *, P < .05; **, P < .01; ***, P < .001.
Supplemental material

Supplemental Material

Download Zip (4.4 MB)