Figures & data
Figure 1. NEDD4L expression level was low in OSCC tissues and had prognostic correlation. Paraffin sections of Stage 1 or 2 OSCC tissues (I/II), Stage 3 or 4 OSCC tissues (III/IV), and adjacent non-tumor tissues (Normal) were assessed. (a) Mean ± S.D. and individual points of NEDD4L mRNA levels. **p < .01; ***p < .001, compared to Normal; ##p < .01, compared to I/II; assessed by ANOVA followed by Tukey’s test. (b) Representative Western blot images showing protein expression levels of NEDD4L in tissues. (c) Representative immunohistochemistry (IHC) images showing the distribution of NEDD4L in NEDD4L-low and -high tumor tissues. (d) Comparison of probability of patient survival with high or low NEDD4L expression level using Log-rank test.
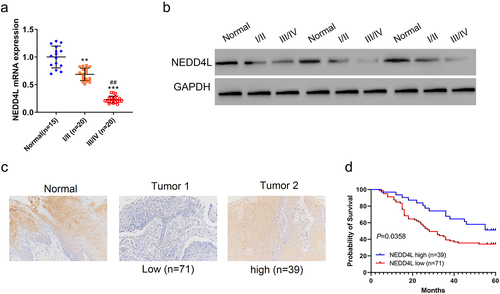
Table 1. Correlation of NEDD4L expression in OSCC tissues with different clinicopathological features (n = 110)
Figure 2. Overexpressing NEDD4L in OSCC cells inhibited cell proliferation and triggered cell cycle arrest, suppressed glycolysis. (a) Western blot results showing NEDD4L expression levels in OSCC cell lines (SCC15 and CAL27) transduced with either control vector or NEDD4LOE. (b) Cell proliferation assay results of OSCC cells with or without NEDD4LOE transduction. (c) Cell cycle analysis results showing flow cytometry assessment of DNA content levels (left; green, yellow and cyan respectively represent cells in G0/G1, S and G2/M phases) and the calculated fraction of cell subpopulations in different phases (right). (d) Western blot results showing p21 and p27 expression levels in OSCC cells with or without NEDD4LOE transduction. (e-f) Mean ± S.E.M. of extracellular acidification rate (ECAR) (e) and oxygen consumption rate (OCR) (f) in OSCC cells with or without NEDD4LOE transduction. (g-h) Mean ± S.E.M. of lactate (g) and ATP (h) production of OSCC cells with or without NEDD4LOE transduction. **p < .01; ***p < .001, assessed by two-tailed Student’s t-test.
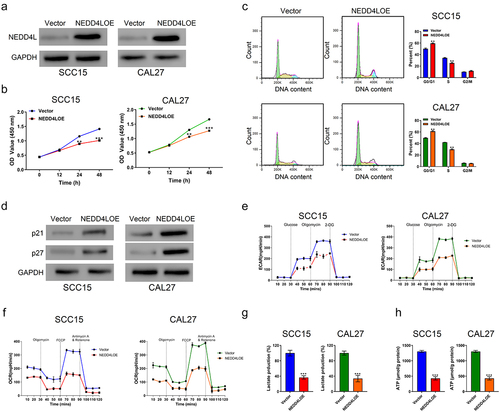
Figure 3. NEDD4L overexpression suppressed mouse tumor growth. Nude mice were injected subcutaneously with SCC15 cells with or without NEDD4LOE transduction. (a) Tumor volume was tracked from Day 12 to Day 33. (b) Tumor pictures (top) and weight (bottom; individual points and mean ± S.D.) on Day 33. (c) Representative IHC images showing Ki67 distribution. (d) Western blot results showing NEDD4L, p21, and p27 expression levels in representative tumor tissues. (e) Comparison of the probability of survival of mice with or without NEDD4L overexpression. *p < .05; ***p < .001, assessed by two-tailed Student’s t-test.
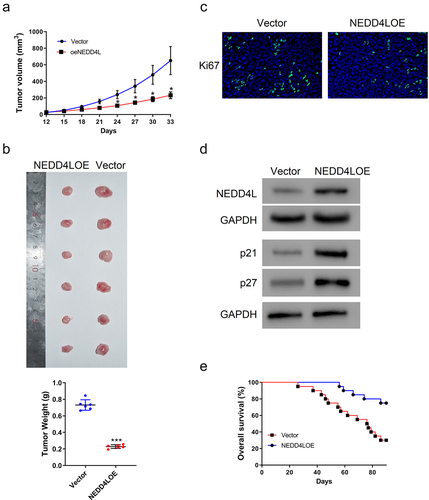
Figure 4. NEDD4L bound to ENO1 and induced its ubiquitination. (a) Co-immunoprecipitation results showing direct association between NEDD4L and ENO1. (b) ENO1 protein (top) and mRNA (bottom) levels in OSCC cells with or without NEDD4LOE transduction. (c) ENO1 protein (left) and mRNA (right) levels in OSCC cells with or without NEDD4L interference. (d) Western blot results showing ENO1 protein level in OSCC cells with or without NEDD4LOE transduction and with or without MG132 treatment. (e) Western blot results of ENO1 from OSCC cells with or without NEDD4LOE. (f) IHC analysis of paraffin sections from patients, staining ENO1 and NEDD4L. Case 1 represents high ENO1 and low NEDDL4, while Case 2 represents low ENO1 and high NEDDL4 (upper). A negative correlation between ENO1 and NEDD4L expression was identified using Fisher’s exact test (bottom).
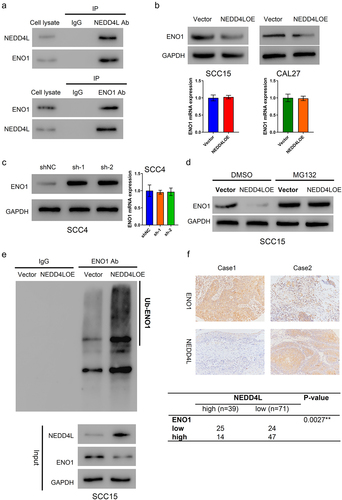
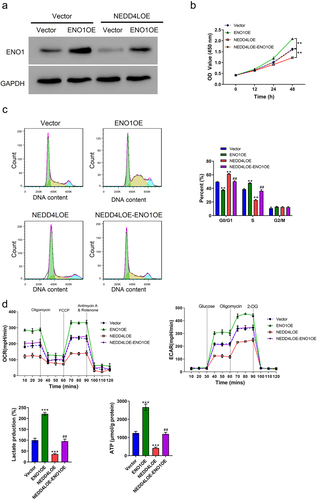
Figure 5. ENO1 overexpression reversed the functional effects of NEDD4L overexpression. (a) Western blot results showing ENO1 protein level in OSCC cells with only ENO1OE transduction or with both NEDD4LOE and ENO1OE transduction. (b-c) Cell proliferation assay (b) and cell cycle analysis (c) of OSCC cells with NEDD4LOE and/or ENO1OE transduction. (d) Mean ± S.E.M. of ECAR and OCR (top) and lactate and ATP production (bottom) of OSCC cells with NEDD4LOE and/or ENO1OE transduction. **p < .01; ***p < .001, compared with Vector group; ##p < .01, compared with NEDD4LOE group; assessed by ANOVA followed by Tukey’s test.