Figures & data
Figure 1. Identification of BMSC and BMSC-derived exosomes.(a and b) proliferative ability of BC cells after incubating with BMSC-derived exosomes (BMSC-Exo) or not was evaluated by CCK-8 and colony formation assays. (c and d) impacts of BMSC-Exo incubation on BC cell migration and invasion were estimated by wound healing and transwell assays, respectively. (e) flow cytometry analysis was carried out to assess the apoptosis of BC cells treated with BMSC-Exo. *P < .05, **P < .01.
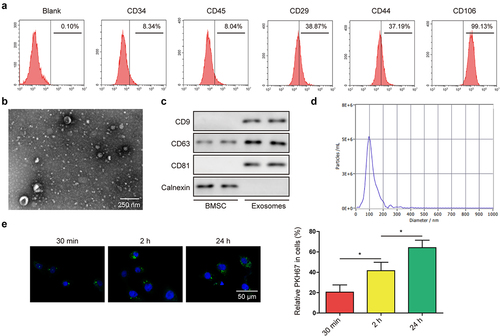
Figure 2. BMSC-derived exosomes suppressed the malignant phenotypes of BC cells.(a) surface markers of BMSC including CD34, CD45, CD29, CD44, and CD106, were detected through flow cytometry. (b) morphology of BMSC-derived exosomes was detected by transmission electron microscopy. (c) positive markers (CD9, CD63, and CD81) and negative marker (calnexin) of exosomes were tested by western blot. (d) NTA was performed to detect the size of the particles. (e) cellular internalization of BMSC-derived exosomes into 5637 cells was detected by confocal microscopy. Scale bar: 50 μm.
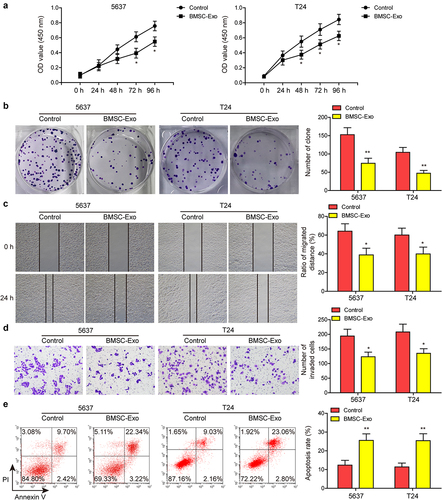
Figure 3. BMSC-derived exosomal PTENP1 regulated the malignant phenotypes of 5637 cells.(a) BMSC-derived exosomes were isolated and the expression of lncRNA PTENP1 in exosomes was examined by qRT-PCR. (b) after 48 h of co-culture with the exosomes derived from NC- or PTENP1-overexpressing BMSC (BMSCOE-NC-Exo, BMSCOE-PTENPCitation1-Exo), 5637 cells were collected and subjected for qRT-PCR analysis of lncRNA PTENP1. (c and d) proliferative ability of 5637 cells treated with BMSCOE-NC-Exo or BMSCOE-PTENPCitation1-Exo was evaluated by CCK-8 and colony formation assays. Impacts of treatment with BMSCOE-NC-Exo or BMSCOE-PTENPCitation1-Exo on 5637 (e) cell migration, (f) invasion, and (g) apoptosis were measured by wound healing, transwell, and flow cytometry assays. *P < .05, **P < .01.
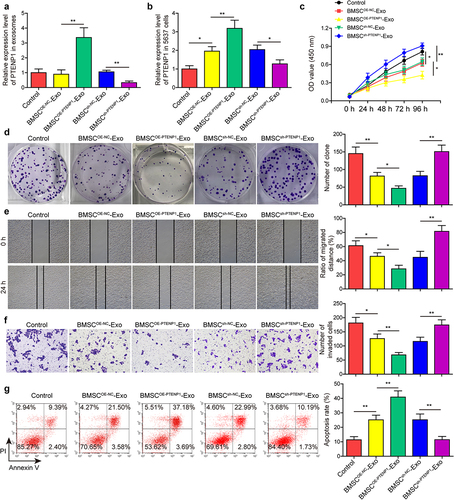
Figure 4. LncRNA PTENP1 promoted the expression of SCARA5 by sponging miR-17.(a and b) the binding sites of miR-17 with PTENP1 or SCARA5. (c and d) interplay between miR-17 and PTENP1 or SCARA5 was validated by dual-luciferase reporter assay. (e-g) RNA pull down and RIP assays were performed to examine the interaction between miR-17 and PTENP1 or SCARA5 in 5637 cells. (h and i) after transfecting with OE-PTENP1 or miR-17 mimics, as well as their negative controls, the expression levels of lncRNA PTENP1, miR-17, and SCARA5 in 5637 cells were tested by qRT-PCR. (j) western blot analysis of SCARA5 in 5637 cells treated with OE-PTENP1 or miR-17 mimics, as well as their negative controls. *P < .05, **P < .01, and ***P < .001.
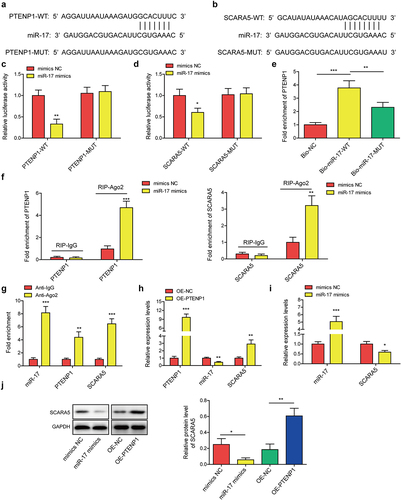
Figure 5. Exosomes derived from PTENP1-overexpressing BMSC abolished the promotive effects of miR-17 overexpression on the malignant phenotypes of 5637 cells.(a) relative expression level of miR-17 in 5637 cells treated with miR-17 mimics and BMSCOE-PTENPCitation1-Exo was measured by qRT-PCR. (b and c) proliferative ability of 5637 cells treated with miR-17 mimics and BMSCOE-PTENPCitation1-Exo was evaluated by CCK-8 and colony formation assays. impacts of treatment with miR-17 mimics and BMSCOE-PTENPCitation1-Exo on 5637 (d) cell migration, (e) invasion, and (f) apoptosis were measured by wound healing, transwell, and flow cytometry assays. *P < .05, **P < .01, and ***P < .001.
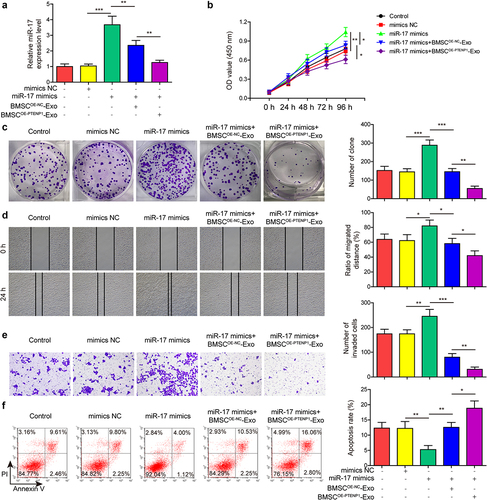
Figure 6. Exosomes derived from PTENP1-overexpressing BMSC abolished the promotive effects of SCARA5 knockdown on the malignant phenotypes of 5637 cells.(a) relative mRNA and protein expression of SCARA5 in 5637 cells treated with sh-SCARA5 and BMSCOE-PTENPCitation1-Exo were measured by qRT-PCR and western blot, respectively. After treatment with sh-SCARA5 and BMSCOE-PTENPCitation1-Exo, 5637 cells were subjected for the analysis of (b and c) proliferation, (d) migration, (e) invasion, and (f) apoptosis. *P < .05, **P < .01, and ***P < .001.
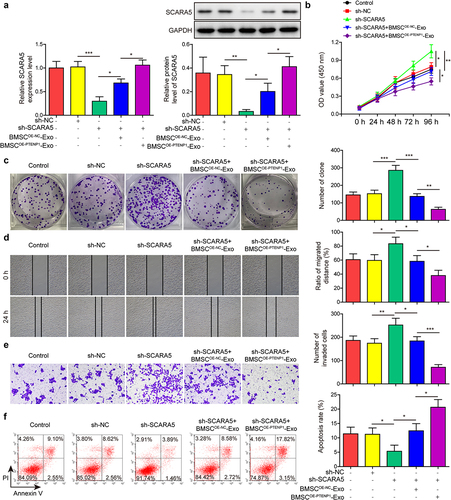
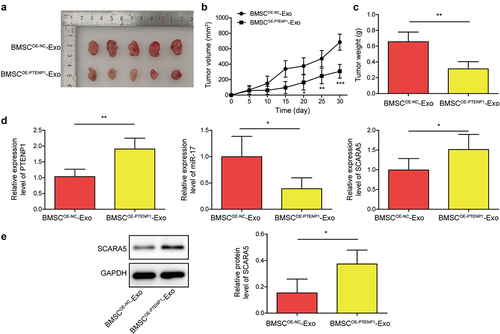
Figure 7. Exosomes derived from PTENP1-overexpressing BMSC repressed BC tumor growth in vivo.(a) representative images of tumors formed by the 5637 cells treated with BMSCOE-NC-Exo or BMSCOE-PTENPCitation1-Exo. (b and c) tumor volume and weight in each group. (d) relative expression levels of lncRNA PTENP1, miR-17, and SCARA5 mRNA in the tumors formed by the 5637 cells treated with BMSCOE-NC-Exo or BMSCOE-PTENPCitation1-Exo were examined by qRT-PCR. (e) western blot analysis of SCARA5 protein in the tumors formed by the 5637 cells treated with BMSCOE-NC-Exo or BMSCOE-PTENPCitation1-Exo. *P < .05, **P < .01, and ***P < .001.