
Figures & data
Figure 1. BRD4 could be a good target for Acute Myeloid Leukemia (AML). (a) BRD4 mRNA expression was characterized in different cancer cell lines (generated from the web site: Broad Cancer Cell Line Encyclopedia: https://depmap.org/portal/download/). High expression of BRD4 was observed in AML cell lines. (b) According to the R2 database (https://hgserver1.amc.nl/cgi-bin/r2/main.cgi, Bohlander-422-fRMA-u133a; source:GEO ID, gse37642), the overall survival rate of high BRD4 expression with AML is lower than that of patients with low BRD4 expression. (c)According to the GEPIA2 database (http://gepia2.cancer-pku.cn/#index), the overall survival rate of high BRD4 expression in patients with AML is lower than that of patients with low BRD4 expression.
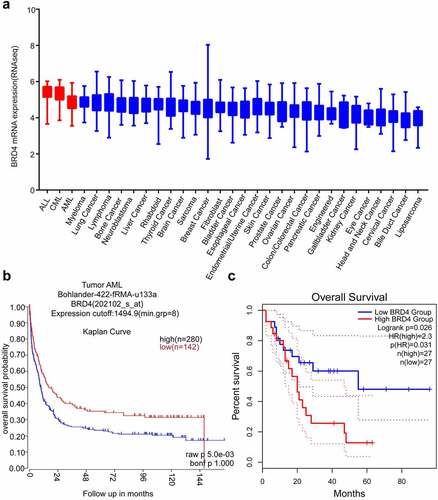
Figure 2. MZ1 suppresses the proliferation of AML cells. (a) Cell viability and IC50 values of NB4, Kasumi-1, MV4-11, and K562 cells after treatment with different concentrations of MZ1 for 48 h. (b) Basal BET protein levels of NB4, Kasumi-1, MV4-11, and K562 cells. (c) Morphology of NB4, Kasumi-1, MV4-11, and K562 cells treated with DMSO or MZ1. (d) Cell growth curves of NB4, Kasumi-1, MV4-11, K562 cells treated with DMSO or MZ1 for 7 days. Each concentration was tested in triplicate and independently performed at least three times. *p < .05, **p < .01, ***p < .001, ****p < .0001.
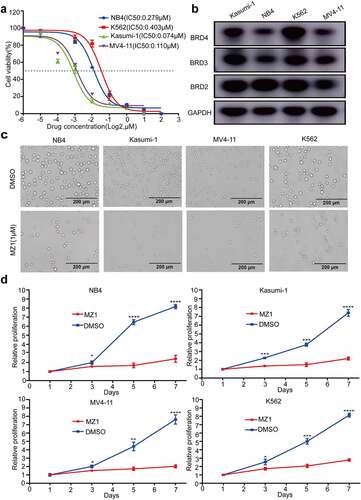
Figure 3. MZ1 clears BET protein expression in AML cell lines. (a) Cell viability of NB4, Kasumi-1, MV4-11 and K562 cell lines treated with different concentrations of MZ1, JQ1 and dBET1 for 48 h. (b) Western blot results showed that MZ1 induced degradation of BET protein and induced PARP cleavage in NB4, Kasumi-1, MV4-11 and K562 cells. Each concentration was tested in triplicate and independently performed at least three times.
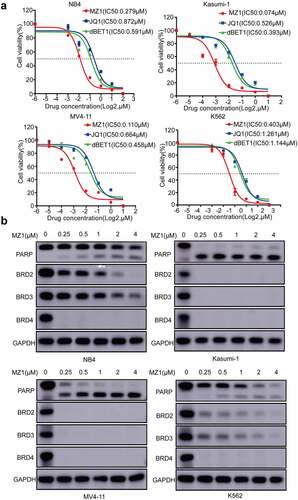
Figure 4. MZ1 blocks the AML cells cycle and promotes apoptosis. (a) PI-labeled cell cycle analysis after 12–24 h treatment of NB4, Kasumi-1, MV4-11 and K562 cell lines with DMSO or MZ1 revealed that AML cells were distributed in the G1/S phase and the cell population in the G1 phase was significantly increased. (b) A dose-dependent increase in apoptosis was observed in AML cell lines after 24 h of MZ1 treatment. Each concentration was tested in triplicate and independently performed at least three times. *p < .05, **p < .01, ***p < .001, ****p < .0001.
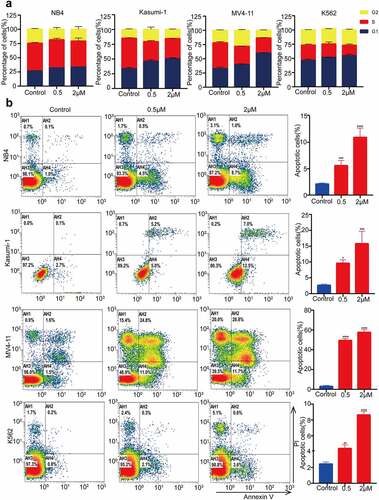
Figure 5. VHL is a powerful helper for MZ1 in AML cell lines; BRD4 protein degradation is dependent on the ubiquitin-proteasome system. (a) Western blot analysis of VHL protein expression in AML cell lines. (b) Schematic illustration of the bifunctional PROTAC molecule (MZ1). (c) sh-VHL or PLVX-VHL lentivirus was transfected into NB4 and Kasumi-1 cells, and the expression level of VHL was detected by Western blot. (d) Comparison of the sensitivity of VHL knockdown or overexpressed NB4 and Kasumi-1 cells. VHL downregulation increased the IC50 of MZ1 in NB4 and Kasumi-1 cells; VHL overexpression decreased the IC50 of MZ1 in NB4 and Kasumi-1 cells. (e) After MZ1 treatment (0.25μΜ) of Kasumi-1 and K562 cells and different concentrations of MG132 for 12 h, Western blot showed that MG132 inhibited BRD2, BRD3 and BRD4 protein degradation in a dose-dependent manner. Each concentration was tested in triplicate and independently performed at least three times. *p < .05, **p < .01, ***p < .001, ****p < .0001.
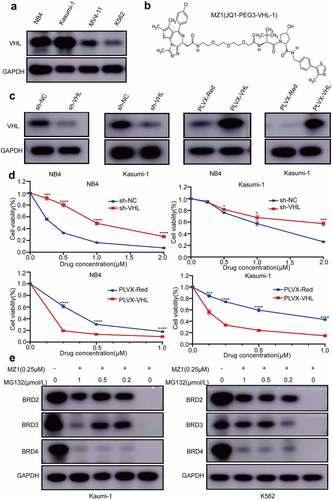
Figure 6. MZ1 suppresses AML cells growth in vivo. (a) Schematic diagram of in vivo experimental design. (b) Representative bioluminescence imaging of mice at different time points in the MZ1 treatment group and the vehicle control group. (c) Bioluminescence imaging of the endpoint liver and spleen in both groups of mice. The color scale indicates the bioluminescence intensity of the counts. (d) Statistical analysis of the bioluminescence imaging values of the two groups of mice at different time points. (e) Survival curves of the two groups of mice. (f) Monitoring of body weight of the two groups of mice. (g) Endpoint liver and spleen size and weight of the two groups of mice. (h) H&E staining analysis of liver, spleen and bone marrow in two groups of mice. (i) Immunohistochemical analysis of spleen tissue sections for BRD4, Ki67 and cleaved-caspase 3 (cl-caspase 3) in the two groups. NS: not significant, **p < .01, **** p < .0001.
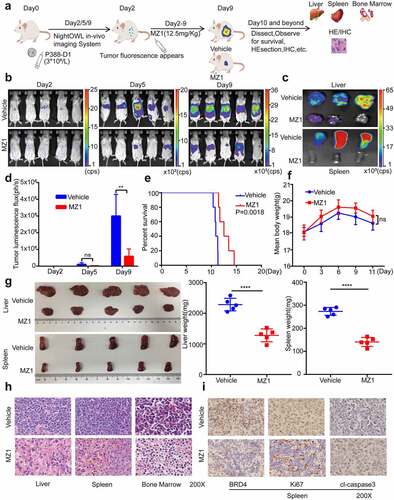
Figure 7. MZ1 decreases c-Myc and ANP32B expression in AML cell lines. (a) RNA-sequencing volcano plot analysis illustrates the expression changes of genes in NB4 cells between the MZ1 treatment and the control groups. Genes highlighted in red were upregulated, and those in blue were downregulated. (b) Heatmap view displayed the top downregulated genes in NB4 cells treated with 2 μM MZ1 for 32 h, including ANP32B. (c) The NB4 cell line chip-seq obtained 328 super enhancers, including super-enhancer associated gene ANP32B, ANP32A and KLF1. (d) After MZ1-treated NB4 cell down-regulated genes and NB4 cell chip-seq obtained super-enhancer associated genes were enriched, 286 common genes were obtained, including ANP32B. (e) GSEA plots displayed gene enrichment in HALLMARK_APOPTOSIS, HALLMARK_P53 and HALLMARK_TGF_BETA signaling pathways in NB4 cells treated with MZ1. (f) Western blot assay for c-Myc and ANP32B expression in the four AML cell lines. (g) Western blot analysis showed that the c-Myc and ANP32B protein levels were downregulated in NB4 and Kasumi-1 cells after treatment with different concentrations of MZ1.
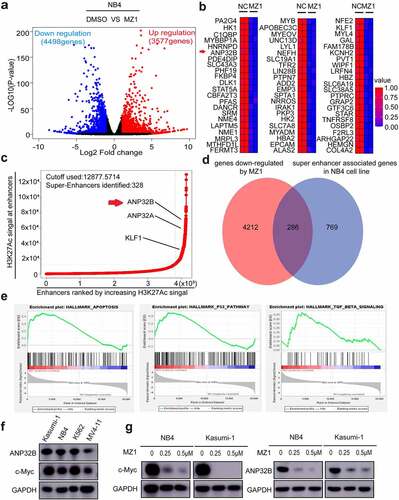
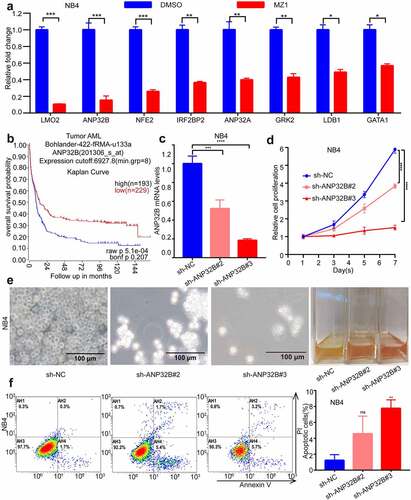
Figure 8. ANP32B knockdown promotes apoptosis of the NB4 cell line and inhibits its proliferation. (a) RT-PCR verified that ANP32B was significantly more downregulated among the downregulated genes after treatment of NB4 with DMSO or MZ1 (2 μM). (b) Patients with high ANP32B expression had lower survival rates than those with low expression. (generated from the web site: https://hgserver1.amc.nl/cgi-bin/r2/main.cgi, Bohlander-422-fRMA-u133a; source:GEO ID, gse37642).(c) RT-PCR verified the ANP32B knockdown by sh-RNAs (sh-ANP32B#2 and sh-ANP32B#3). (d, e) White slice and CCK8 assays showed that ANP32B knockdown significantly inhibited the proliferation of NB4 cells compared to scramble cells. (f) Compared to the scramble cells, apoptosis was increased in NB4 cell after ANP32B knockdown.
Supplemental Material
Download JPEG Image (140 KB)
Data Availability Statement
The data that support the findings of this study are available on reasonable request from the corresponding author. RNA‑seq and original data have been submitted to the GEO database with Accession Number GSE198011 https://www.ncbi.nlm.nih.gov/geo.