Figures & data
Figure 1. Overexpression of DDX24 correlates with poor survival, and the functional enrichment analysis of DDX24 in HCC. (a) Kaplan-Meier overall survival analysis of liver cancer tissues with high (blue line) or low (red line) DDX24 expression based on the data obtained from TCGA dataset. (b) Network map showed the relationships between DDX24 and neighboring genes using GeneMANIA tool. (c) The PPI network of DDX24 was conducted using STRING tool. (d) Interaction network map on the top 50 co-expressed genes of DDX24 (P < .05) was conducted using Cytoscape tool. The purple circles were interacted genes, the white circles were un-interacted genes. (e) KEGG pathway enrichment analysis on the top 18 co-expressed genes of DDX24 (|Spearman correlation coefficient| >0.4 and p < .01) in liver cancer samples obtained from TCGA dataset.
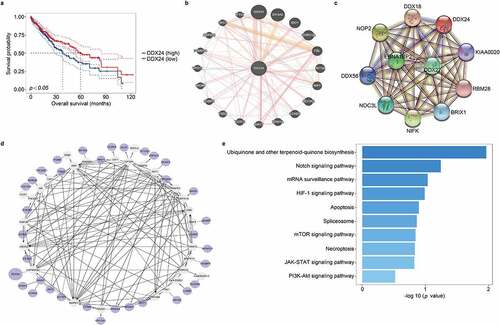
Figure 2. DDX24 regulates proliferation and migration of HCC cells. (a, b) Efficacy of DDX24 knockdown (a) or overexpression (b) in Hep3B and Bel-7402 cells was analyzed by the RT-qPCR and western blot analysis. (c, d) Cell viability was detected by CCK-8 assays after Hep3B and Bel-7402 cells transfecting with DDX24-specific shRNAs (c) or DDX24 plasmid (d). (e, f) Cell migration rates of Hep3B and Bel-7402 cells transfected with shRNAs (e) or DDX24 plasmid (f) were measured by trans-well assays, and representative qualification was shown in the right panel. Scale bar = 100 μM. (g-j) Western blot analysis of DDX24, AKT, p-AKT, ERK, p-ERK, ZO-1, N-cadherin and β-catenin expression after DDX24 knockdown or overexpression in Hep3B and Bel-7402 cell lines. β-actin or GAPDH was used as the loading control. The results were shown as means ± SD, *p < .05, ** p < .01, *** p < .001, *** p < .0001; n. s., not significant.
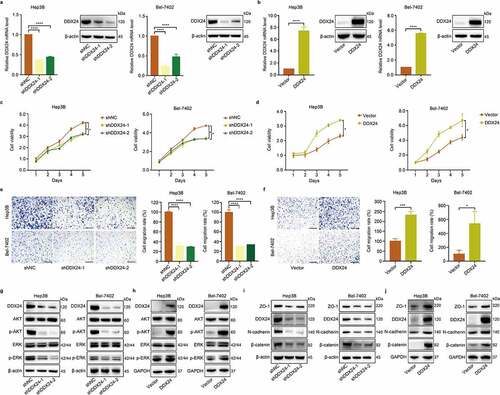
Figure 3. DDX24 regulates sorafenib-mediated inhibition of proliferation in HCC cells. (a, c) Cytotoxic effect of sorafenib (SFN) at the indicated doses on Hep3B and Bel-7402 cells transfected with DDX24-specific shRNAs (a) or DDX24 plasmid (c) was determined by CCK-8 assays after 48 hr, and IC50 of the cell lines exposed to SFN was analyzed. (b, d) Cell viability of Hep3B and Bel-7402 cells after transfecting with shRNAs (b) or DDX24 plasmid (d) followed by the treatment with SFN was detected by CCK-8 assays. (e, f) Colony formation assays of DDX24 knockdown (e) or overexpression (f) Hep3B and Bel-7402 cells treated with DMSO or SFN for 14 days, and representative qualification was shown in the right panel. (g) Expression of DDX24, AKT, p-AKT, ERK, p-ERK was tested by the western blot analysis. β-actin was used as the loading control. The results were shown as means ± SD, *p < .05, ** p < .01, *** p < .001, *** p < .0001; n. s., not significant.
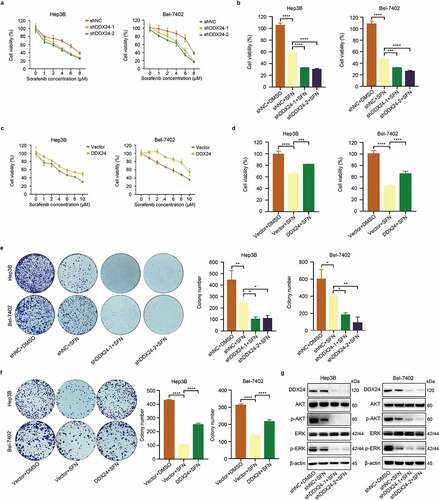
Figure 4. DDX24 regulates sorafenib-induced apoptosis and sorafenib-mediated inhibition of migration in HCC cells. (a, b) Apoptosis rates of Hep3B and Bel-7402 cells transfected with DDX24-specific shRNAs (a) or DDX24 plasmid (b) followed by the treatment with SFN for 48 hr were determined by flow cytometry assays, and representative qualification was shown in the right panel. (c, d) Cell migration rates of DDX24 knockdown (c) or overexpression (d) Hep3B and Bel-7402 cells treated with DMSO or SFN for 48 hr were detected by trans-well assays, and representative qualification was shown in the right panel. Scale bar = 100 μM. (e, f) Representative immunofluorescent images of phalloidin (red) in Hep3B (e) and Bel-7402 (f) cells transfected with shNC, shDDX24-1 and shDDX24-2 followed by the treatment with SFN. Blue, nucleus. Scale bar = 5 μM. (g, h) Expression of PARP, cleaved caspase-7, ZO-1, N-cadherin and β-catenin proteins was evaluated by the western blot analysis. β-actin was used as the loading control. The results were shown as means ± SD, *p < .05, ** p < .01, *** p < .001, *** p < .0001; n. s., not significant.
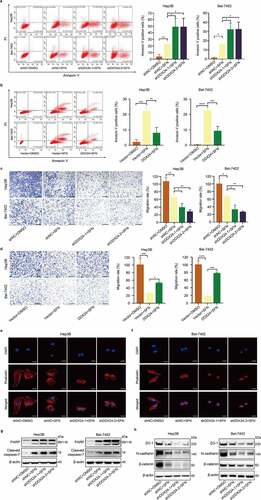
Figure 5. DDX24 knockdown elevates sorafenib-mediated inhibition of HCC growth in vivo. (a-c) Representative images of xenograft tumors derived from BALB/c nude mice (a) subcutaneously injected with DDX24 knockdown and negative control Hep3B stable cells, and administration with PBS or SFN (60 mg/kg) orally once daily. The tumor volume (b) and weight (c) were measured (N = 5). (d) Representative IHC staining of Ki67, p-ERK, β-catenin and ZO-1 from tumor sections, and representative qualification was shown in the right panel. Scale bar = 100 μM. (e) The expression of DDX24, ERK, p-ERK, β-catenin and ZO-1 in tumor xenografts was tested by western blot analysis. GAPDH was used as the loading control. The results were shown as means ± SD, *p < .05, ** p < .01, *** p < .001, *** p < .0001; n. s., not significant.
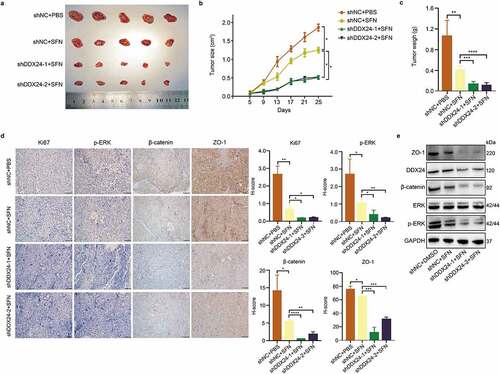
Figure 6. DDX24 regulates chemosensitivity of HCC cells to sorafenib via SNORA18 signaling. (a) Heat map from global comparative transcriptome analysis. Bel-7402 cells were treated with SFN at the indicated dose, and total RNA was extracted for analysis after 48 hr. (b) Results of RNA-seq on DDX24 knockdown Hep3B cells and Bel-7402 cells administrated with SFN were crosslinked to seek differentially regulated genes (log2FC ≥1.5, p < .01). Venn diagram showed a small subset candidates (4 simultaneous upregulated genes). (c, d) RT-qPCR was used to detect the relative RNA level of SNORA18 in Hep3B and Bel-7402 cells transfected with shNC, shDDX24-1 and shDDX24-2 (c), and exposed to SFN at the indicated doses (d). (e, f) Relative RNA level of SNORA18 in DDX24 knockdown (e) or overexpression (f) Hep3B and Bel-7402 cells treated with DMSO or SFN was determined by RT-qPCR. (g, i) Efficacy of SNORA18 knockdown (g) or overexpression (i) in Hep3B and Bel-7402 cells transfected with antisense oligonucleotide (ASO) or SNORA18 plasmid was analyzed by the RT-qPCR analysis. (h, j) Cell viability was detected by CCK-8 assays after Hep3B and Bel-7402 cells transfecting with SNORA18-specific ASO (h) or SNORA18 plasmid (j). (k, l) Cell migration rates of SNORA18 knockdown (k) or overexpression (l) Hep3B and Bel-7402 cells were measured by trans-well assays, and representative qualification was shown in the right panel. Scale bar = 100 μM. The results were shown as means ± SD, *p < .05, ** p < .01, *** p < .001, *** p < .0001; n. s., not significant.
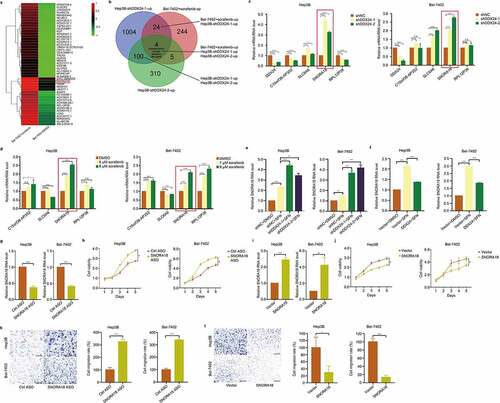
Figure 7. SNORA18 knockdown or overexpression reverts the chemosensitivity alteration induced by DDX24 in sorafenib-treated HCC cells. (a) RT-qPCR was used to detect the relative RNA level of SNORA18 in Hep3B and Bel-7402 cells transfected with shNC, shDDX24 and shDDX24+ SNORA18 ASO followed by the treatment with DMSO or SFN. (b-d) The shNC HCC cells exposed to DMSO and shNC, shDDX24, shDDX24+ SNORA18 ASO HCC cells exposed to SFN were subjected to cell viability (b), colony formation (c) and cell migration assays (d). Scale bar = 100 μM. (e-h) The vector HCC cells exposed to DMSO and vector, DDX24, DDX24+ SNORA18 HCC cells exposed to SFN were subjected to RT-qPCR (e), cell viability (f), colony formation (g) and cell migration assays (h). Scale bar = 100 μM. (i) Western blot analysis of DDX24, AKT, p-AKT, ERK, p-ERK, ZO-1, N-cadherin, β-catenin, PARP and cleaved caspase-7 expression after SNORA18 knockdown in Hep3B cells treated with DDX24-specific shRNA and SFN. GAPDH was used as the loading control. The results were shown as means ± SD, *p < .05, ** p < .01, *** p < .001, *** p < .0001; n. s., not significant.
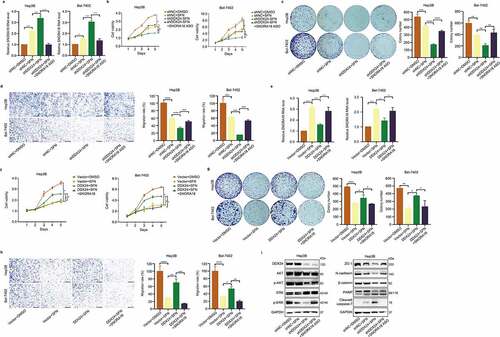
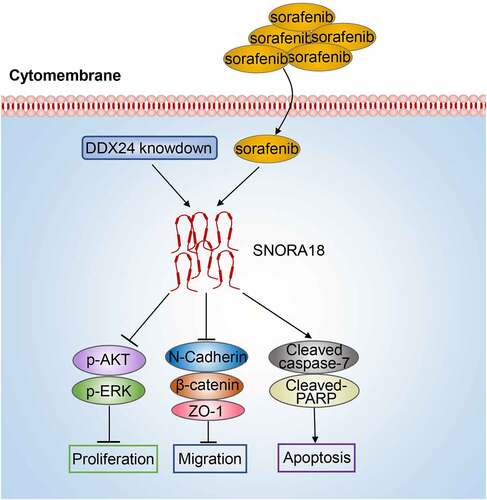
Figure 8. Schematic model: DDX24 modulates the chemosensitivity of SFN in HCC treatment via SNORA18 dependent pathway. DDX24 knockdown synergized with SFN enhanced the inhibitory effects of cell proliferation and migration via AKT/ERK and EMT pathway in HCC. Downregulation of DDX24 elevated sorafenib-induced apoptosis via caspase/PARP pathway in HCC. Mechanistically, DDX24 regulated SFN sensitivity in HCC treatment via mediating the expression of its target SNORA18.