
Figures & data
Figure 1. Surface expression of DR5 and TRAIL sensitivity of Jurkat and pancreatic cancer cells. FACS data demonstrate surface expression of DR5 on Jurkat (a), AsPC1(b) and Panc1 (c) cells. Cells were incubated with the APC-conjugated anti-DR5 antibody and analyzed by flow cytometry. The red line indicates cells labeled with anti-DR5 antibody and black line for unlabeled cells. (d) TRAIL sensitivity of AsPC1, Panc1 and Jurkat cancer cells. Caspase-8 activity was measured in Jurkat, and pancreatic cancer cells treated with increasing concentrations of TRAIL (0.000001–10 μg/ml). Data are presented as mean ± standard deviation (N = 3).
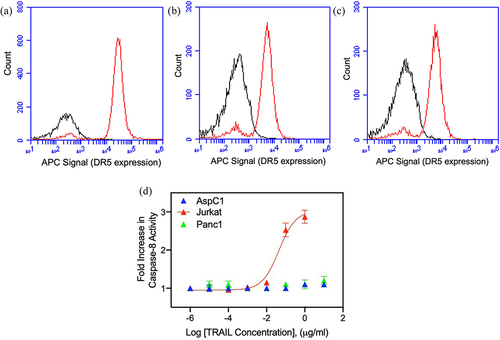
Figure 2. Effect of nimesulide on TRAIL-induced caspase-8 activity. (a) Caspase-8 activity was measured in Jurkat cells treated with nimesulide-only (50 μM), TRAIL (0.1 μg/ml) +DMSO or TRAIL+nimesulide (50 μM) or DMSO only. (b) Determination of EC50 of nimesulide by caspase-8 assay. Jurkat cells were incubated with increasing concentrations of nimesulide (0.001–200 uM) and TRAIL (0.01–0.1 μg/ml). Data are presented as mean ± standard deviation (N = 3). ****P < .0001 compared to control by two-tailed unpaired t test.
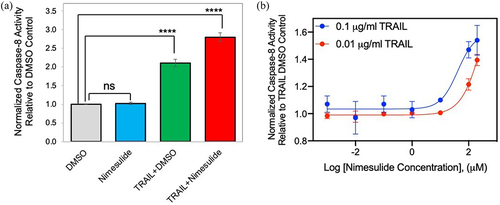
Figure 3. Effect of nimesulide on caspase-8 activity in AsPC1 and Panc1 cancer cells. Caspase-8 activity was measured in AsPC1 (a) and Panc1 (b) cancer cells treated with increasing concentrations of nimesulide-only (0.001–200 μM). (c) AspC1 cells treated with increasing concentrations of TRAIL (0.000001–10 μg/ml) +DMSO or TRAIL+nimesulide (50 μM). (d) PanC1 cells treated with increasing concentrations of TRAIL (0.000001–10 μg/ml) +DMSO or TRAIL+nimesulide (50 μM). Data are presented as mean ± standard deviation (N = 3).
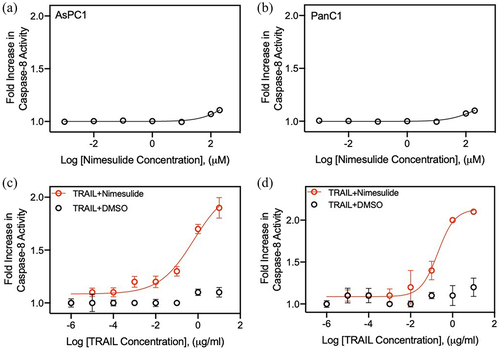
Figure 4. Effect of nimesulide on TRAIL-induced apoptosis in pancreatic cancer cells and proliferation of all three cancer cells. Apoptosis was measured using MTT assay in AsPC1 (a) and Panc1 (b). Cancer cells were treated with increasing concentrations of TRAIL (0.000001–10 μg/ml) +DMSO or TRAIL+nimesulide (50 μM). Data are presented as mean ± standard deviation (N = 3). AsPC1 (c), Panc1 (d) and Jurkat (e) cells were treated separately with DMSO or nimesulide (0.001–200 μM) and incubated for 24 hours and cell proliferation was measured using MTT assay. Data are mean ± SD (N = 3).
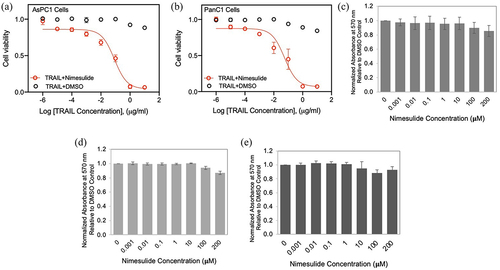
Figure 5. Effect of nimesulide on TRAIL binding. Jurkat cells were incubated with TRAIL (0.1 μg/ml) +DMSO or TRAIL+nimesulide (effective dose concentration). TRAIL binding was detected with rabbit anti-Flag antibody, followed by AF647-conjugated anti-rabbit secondary antibody, as measured by flow cytometry. Data are presented as mean ± standard deviation (N = 3).
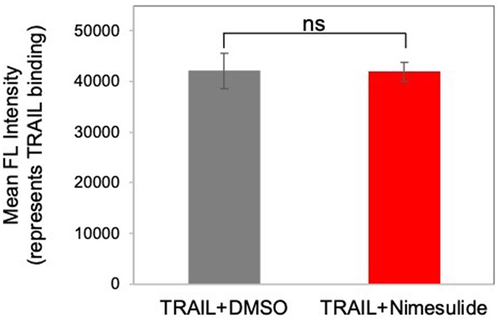
Figure 6. Effect of nimesulide on DR5 clustering. Panc1 cells were treated separately with DMSO (a), TRAIL+DMSO (b), bioymifi (c), nimesulide (d) and nimesulide+TRAIL (e). The next day cells were fixed with 4% paraformaldehyde and then labeled with APC-conjugated anti-DR5 antibody. Cells were mounted with antifade mounting medium with DAPI. Fluorescence images of cells were taken using ImageXpress Pico imaging system.
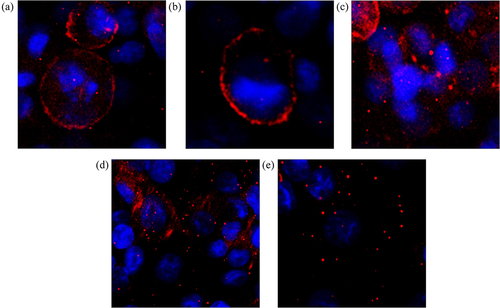
Figure 7. Effect of nimesulide on DR5-DR5 interactions. (a) Schematic of DR5ΔCD-FRET pair biosensor. Pre-ligand assembled DR5 dimers show FRET, which will be increased if small molecules are promoting DR5 clustering. (b) Fluorescence microscopy images showing the expression of DR5ΔCD-GFP and DR5ΔCD-RFP in cells transfected with DR5ΔCD-FRET pair (c) Fluorescence lifetime measurements with HEK293 cells transiently expressing DR5ΔCD-GFP only and DR5ΔCD-FRET pair. (d) FRET efficiency increased with nimesulide and bioymifi treatment compared to DMSO control. Data are mean ± SD (N = 3). ****P < .0001 compared to DMSO control by two-tailed unpaired t test.
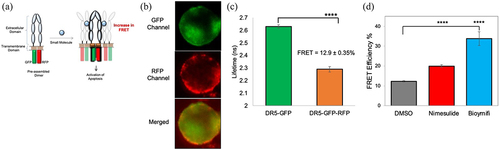
Figure 8. Effect of nimesulide on DR5 expression. FACS data demonstrate surface expression of DR5 on AsPC1 (a) or Panc1 (b) cells. Cells were treated separately with DMSO or nimesulide and incubated for 24 hours. After incubation cells were washed with PBS and incubated with APC-conjugated anti-DR5 antibody and analyzed by flow cytometry. The black line indicates for unlabeled cells, green for cells treated with DMSO and Orange (50 μM) and magenta (100 μM) for cells treated with nimesulide. (c) Cancer cells were treated with or without nimesulide (50 μM) and incubated for 24 hours. After incubation cells were washed with PBS and lysed with native lysis buffer. Equal amounts of total protein were loaded and resolved by 4–20% Tris-glycine SDS−PAGE gels and immunoblotted with antibodies against DR5 and β-Actin.
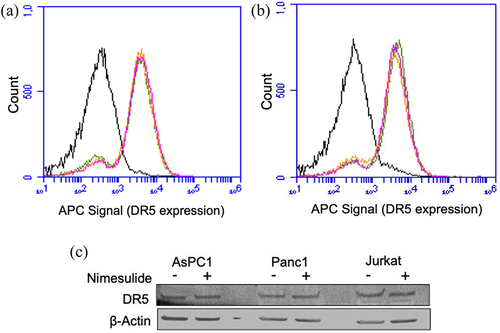
Figure 9. Effect of nimesulide on FADD overexpression-induced apoptosis in HEK293 cells. (a) Western blot analysis of HEK293 cell lysates of untransfected and FADD transfected cells (b) Overexpression of FADD increases caspase-8 activity in HEK293 cells. (c) Effect of nimesulide on endogenous caspase-8 activity in HEK293 cells. (d) Effect of nimesulide on FADD-induced caspase-8 activity in HEK293 cells overexpressing FADD. Data are presented as mean ± standard deviation (N = 3). ****P < .0001 compared to control by two-tailed unpaired t test.
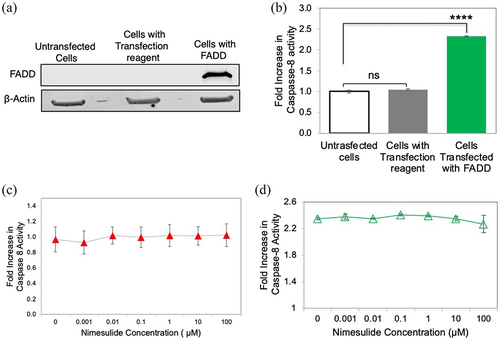
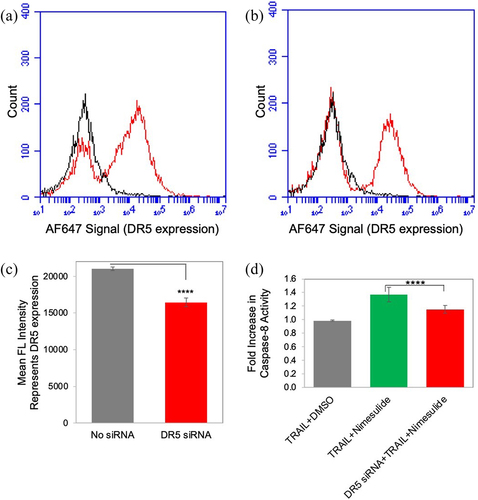
Figure 10. Effect of nimesulide on DR5 siRNA transfected cells. FACS data demonstrate surface expression of DR5 on Panc1 cells (a) and with DR5 siRNA transfected Panc1 (b) cells. (c) Mean FL intensity of transfected and untransfected panc1 cells. Cells were transfected with DR5 siRNA oligonucleotides (25 nM) using lipofectamine 3000. Transfected cells were incubated for 48 hours before further analysis. DR5 expression was determined using anti-DR5 antibody and analyzed by flow cytometry. (d) Caspase-8 activity was measured in siRNA transfected and untransfected panc1 cell. Cells were treated with TRAIL (0.1 μg/ml) +DMSO or TRAIL+nimesulide (50 μM). Data are presented as mean ± standard deviation (N = 3) ****P < .0001 compared to TRAIL nimesulide control by two-tailed unpaired t test.
Supplemental Material
Download Zip (900.7 KB)Data availability statement
The datasets used or analyzed during the current study are available from the corresponding author on reasonable request.