Figures & data
Figure 1. Chemical structure of Apicidin.
Figure 2. Apicidin inhibits proliferation, promotes apoptosis and induces myeloid differentiation of AML cells. (a-c) THP-1 (a), NB4 (b), and HL-60 (c) cells were treated with Apicidin for 48-72h. Then cell proliferation was evaluated by CCK-8 assay, cell apoptosis analyses were performed using double staining of Annexin V and 7-AAD followed by flow cytometry assay, and myeloid differentiation markers CD14 and/or CD11b were characterized by flow cytometric analyses. (d-f) The bone marrow MNCs were isolated from three independent AML patients and treated with Apicidin for indicated times. Then cell proliferation was evaluated by CCK-8 assay, cell apoptosis analyses were performed using double staining of Annexin V and 7-AAD followed by flow cytometry assay, and myeloid differentiation markers CD14 and CD11b were characterized by flow cytometric analyses. *P< .05, **P< .01, ***P< .001, Student’s t-test.
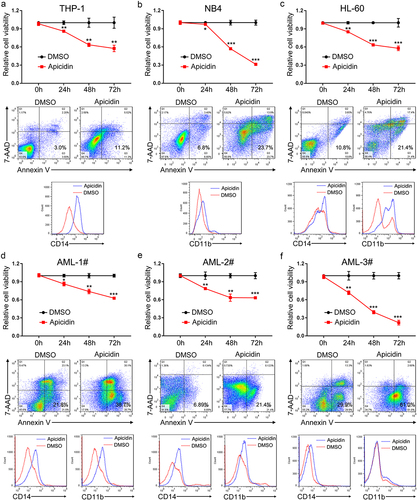
Figure 3. QPCT is identified as a potential downstream target of Apicidin in AML cells. (a) QPCT protein expression was detected by western blot in THP-1, NB4 and HL-60 cells treated with Apicidin or DMSO for 48h. (b-c) Qrt-PCR (b) and western blot (c) analyses of QPCT expression in Apicidin-treated AML MNCs. (d) Ultrasonication effiency of the genomic DNA detected by agarose gel electrophoresis. (e) Sketch map showing the distribution of primers used to expand the putative H3K27ac and H3K9ac binding sites in QPCT promoter region. (f) ChIP-Qrt-PCR analysis of H3K27ac and H3K9ac binding level in the QPCT promoter region after Apicidin treatment in HL-60 cells. *P< .05, **P< .01, ns: not significant, Student’s t-test.
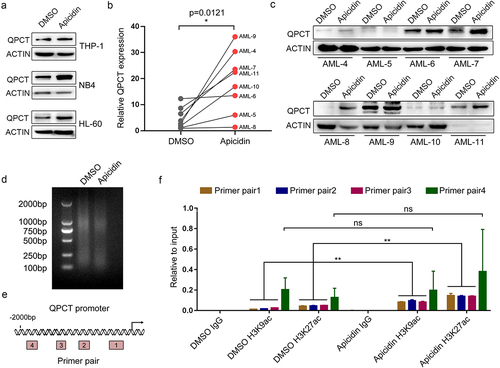
Figure 4. QPCT presents decreased expression in AML patients and increases upon myeloid induction. (a) Qrt-PCR analysis of QPCT mRNA expression in bone marrow MNCs derived from 29 AML patients (FAB M1 to M5 subtypes) and 28 normal controls. (b) Western blot analysis of QPCT protein level in 12 AML patients and 12 normal controls. (c-f) Qrt-PCR and western blot analyses of QPCT expression during PMA-induced macrophage-like differentiation of THP-1 (c) and HL-60 (d) cells and ATRA-induced granulocytic differentiation of NB4 (e) and HL-60 (f) cells. ***P< .001, Student’s t-test.
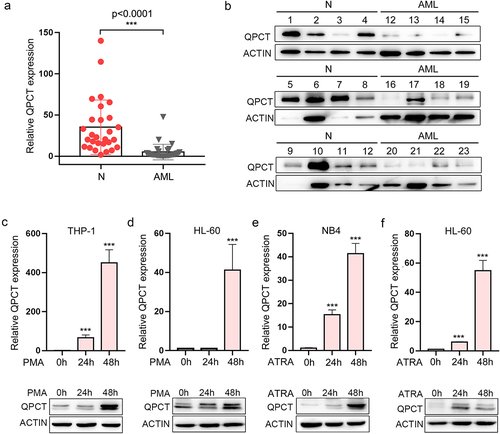
Figure 5. QPCT regulates the proliferation, apoptosis and myeloid differentiation of AML cells. (a-b) THP-1 and HL-60 cells were infected with lenti-ctrl and lenti-shQPCT, replaced with fresh medium 24h later and cultured for another 48h. Then QPCT expression was detected by Qrt-PCR and western blot in THP-1 (a) and HL-60 cells (b). (c-d) Cell proliferation was evaluated by CCK-8 assay (c) and cell apoptosis analyses were performed using double staining of Annexin V and 7-AAD followed by flow cytometry assay (d) in infected THP-1 cells. (e) CD14 expression was evaluated by cytometric analyses in THP-1 cells that were infected with lenti-shQPCT (or lenti-ctrl) followed by PMA induction. (f-g) Cell proliferation was evaluated by CCK-8 assay (f) and cell apoptosis analyses were performed using double staining of Annexin V and 7-AAD followed by flow cytometry assay (g) in infected HL-60 cells. (h) CD14 expression was evaluated by cytometric analyses in HL-60 cells that were infected with lenti-shQPCT (or lenti-ctrl) followed by PMA induction. (i) CD11b expression was evaluated by cytometric analyses in infected and ATRA-induced HL-60 cells. *P< .05, **P< .01 and ***P< .001, Student’s t-test.
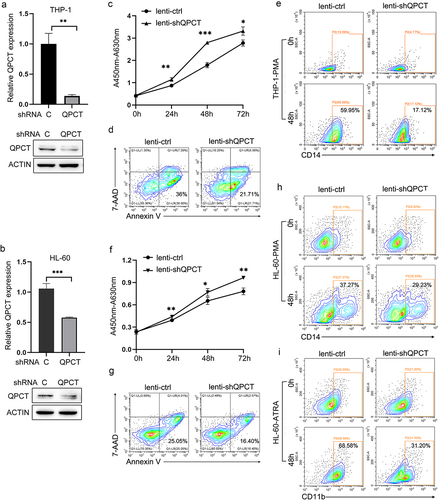
Figure 6. QPCT partly underlies the therapeutic effect of Apicidin on AML. THP-1 and HL-60 cells were infected with lenti-shQPCT or lenti-ctrl, and twenty-four hours later, the cells were changed into fresh complete medium with Apicidin or DMSO. (a-b) QPCT protein expression was evaluated by western blot in THP-1 (a) and HL-60 (b) cells. (c-d) Cell proliferation was analyzed by CCK-8 in THP-1 (c) and HL-60 (d) cells. (e-f) Cell apoptosis analyses were performed using double staining of Annexin V and 7-AAD followed by flow cytometry assay in THP-1 (e) and HL-60 cells (f). (g-h) Myeloid differentiation marker CD14 was characterized by flow cytometric in THP-1 (g) and HL-60 cells (h). (i) Myeloid differentiation marker CD11b was characterized by flow cytometric analysis in HL-60 cells. *P< .05, **P< .01 and ***P< .001, Student’s t-test.
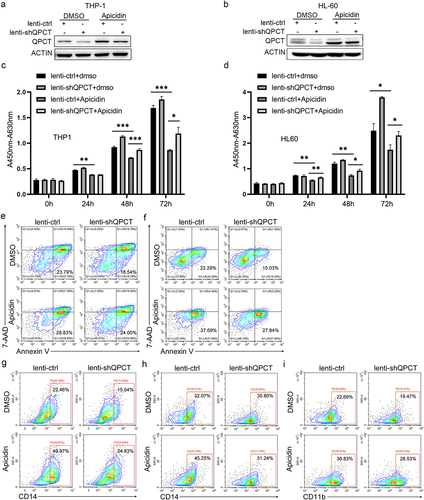
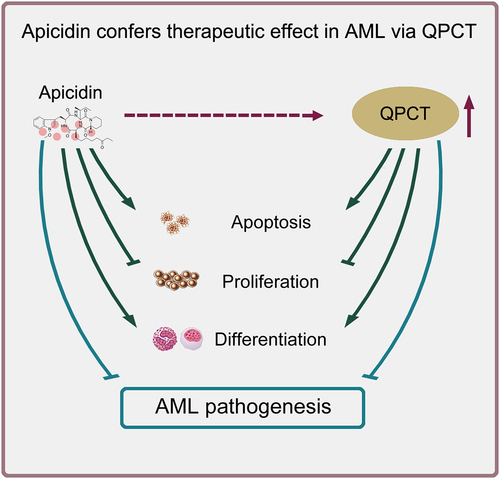
Figure 7. Schematic representation of Apicidin-mediated therapeutic effect on AML. Apicidin increases QPCT expression and confers therapeutic effect on AML by simultaneously inhibiting cell proliferation, promoting apoptosis and inducing myeloid differentiation of AML cells.