Figures & data
Table 1. Real-time PCR primer synthesis list.
Figure 1. Hsa_circ_0119412 was upregulated in HCC. (a) expression of hsa_circ_0119412 was evaluated via qRT-PCR in THLE2 and three HCC (SNU-182, Huh7 and Hep 3B) cell lines. (b) expression of hsa_circ_0119412 was evaluated in adjacent normal and HCC tissues by qRT-PCR assay. (c) localization of hsa_circ_0119412 expression was assessed by qRT-PCR assay in the cytoplasmic and nuclear fractions. (d) the qRT-PCR was done to measure hsa_circ_0119412 and PER2 expressions in the presence or absence of RNase R. **P < .01 vs. THLE2/Control.
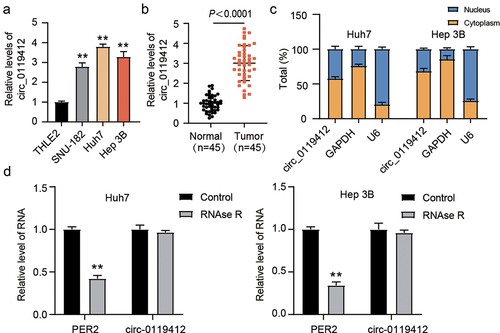
Figure 2. Hsa_circ_0119412 knockdown suppressed HCC progression. (a) Huh7 and Hep 3B were transfected with si-circ_0119412 or si-NC, and transfection efficiency was measured by qRT-PCR. (b) cell proliferation in these above mentioned transfected cells was determined using CCK-8 assay. (c) the migration in these above mentioned transfected cells was assessed using wound healing assay. (d) the levels of apoptotic molecules (Bax and Bcl-2) in transfected Huh7 and Hep 3B cells were determined by immunoblotting. (e) the volume of the tumor xenograft was measured every week for 5 consecutive weeks, and after 5 weeks, the tumor was excised, imaged, and weighed (n = 5). **P < .01 vs. si-NC/sh-NC.
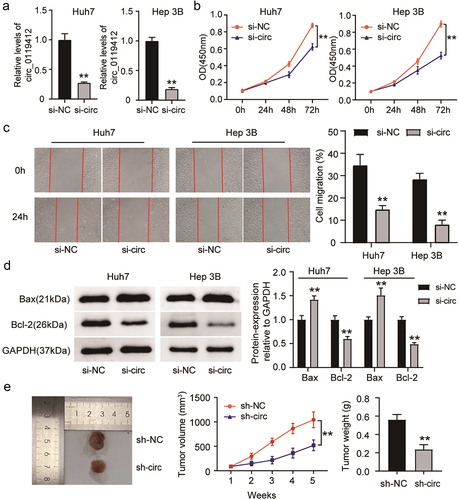
Figure 3. Hsa_circ_0119412 directly targeted miR-526b-5p. (a) circInteractome predicted the complementary binding sequences for miR-526b-5p in hsa_circ_0119412. (b) detection of relative luciferase activity by co-transfecting the cells with either miR-526b-5p mimic or miR-NC along with either circ_0119412-WT or MUT. (c) the interaction of miR-526b-5p and hsa_circ_0119412 was examined using RIP assay. (d) miR-526b-5p expression was assessed in THLE2 and HCC cells (Huh7 and Hep 3B) via qRT-PCR. (e) miR-526b-5p level was evaluated in adjacent normal and HCC tissues via qRT-PCR assay. (f) correlation between hsa_circ_0119412 and miR-526b-5p in cohort of HCC tissues was analyzed through Spearman correlation analysis.
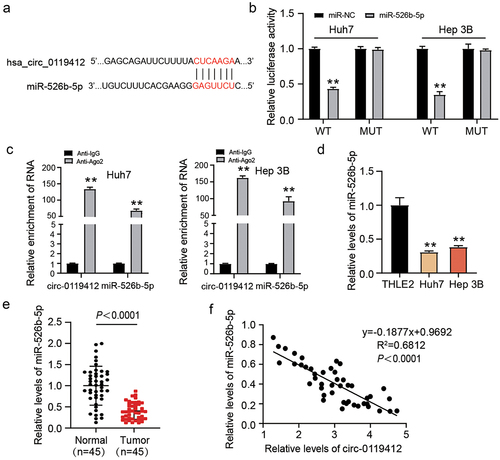
Figure 4. Hsa_circ_0119412 depletion repressed HCC progression via targeting miR-526b-5p. Transfection was carried out in Huh7 and Hep 3B cells with (i) si-circ_0119412 (si-circ) (ii) inhibitor (for miR-526b-5p) (iii) si-circ+inhibitor, and corresponding NCs. (a) MiR-526b-5p level was measured by qRT-PCR in the transfected cells. (b) cell proliferation in various transfected groups was determined by CCK-8 assay. (c) the changes of migratory capacity in different transfected groups were assessed by wound healing assay. (d) the protein levels of apoptotic molecules as determined in different groups by immunoblotting. **P < .05, **P < .01 vs. si-NC, #P <.05, ##P <.01 vs. inhibitor-NC and &P <.05, &&P <.01 vs. si-circ+inhibitor.
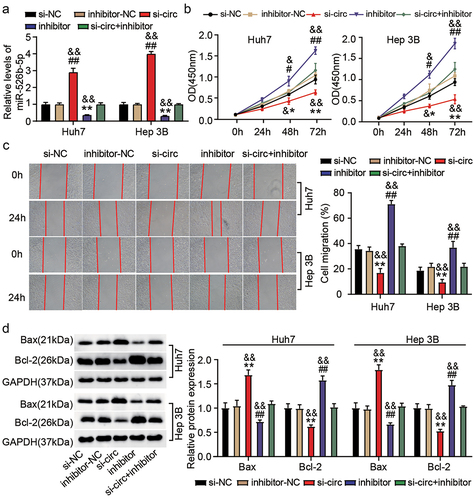
Figure 5. miR-526b-5p target STMN1. (a) TargetScan predicted the binding sites among miR-526b-5p and STMN1. (b) detection of relative luciferase activity by co-transfecting the cells with either miR-526b-5p mimic or miR-NC along with either STMN1 3’-UTR-WT or MUT. (c) STMN1 expression was evaluated by qRT-PCR in adjacent normal and HCC tissues. (d) the expression level of STMN1 was evaluated by qRT-PCR in THLE2 and HCC cells (Huh7 and Hep 3B). (e) correlation among the expressions of STMN1 and miR-526b-5p in cohort of HCC tissues was analyzed through Spearman correlation analysis.
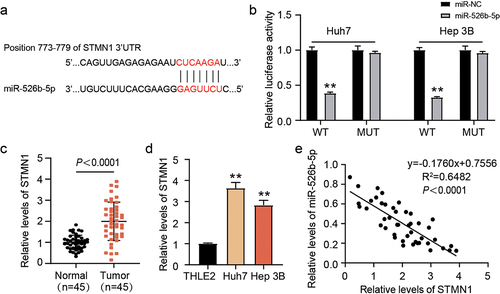
Figure 6. MiR-526-5p depletion counteracted the effect of STMN1 inhibition on HCC. Transfection was done in Huh7 and Hep 3B cells with (i) si-STMN1 (ii) inhibitor (for miR-526b-5p) (iii) si-STMN1+inhibitor, and corresponding NCs. (a) relative protein level of STMN1 in various transfected groups was determined by immunoblotting. (b) cell proliferation was determined by CCK-8 assay in various transfected groups. (c) the changes of migratory capacity were assessed by wound healing assay in different transfected groups. (d) the protein levels of apoptotic molecules as determined by immunoblotting in different transfected groups. **P < .05, **P < .01 vs. si-NC, #P <.05, ##P <.01 vs. inhibitor-NC and &P <.05, &&P <.01 vs. si-STMN1+inhibitor.
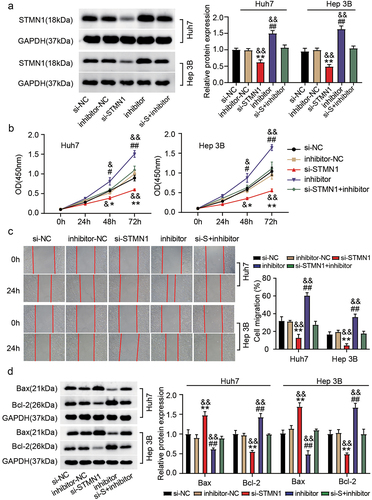
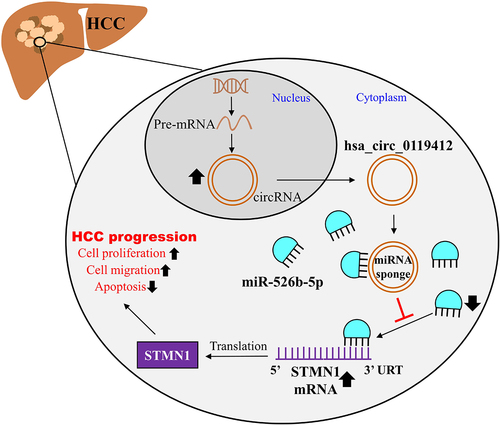
Figure 7. The regulatory mechanism of hsa_circ_0119412/miR-526-5p/STMN1 axis in HCC.