
Figures & data
Figure 1. LINC00839 is deregulated in the bladder cancer.
(a) The expression profile of LINC00839 in unpaired bladder cancer tissues and normal tissues obtained from TCGA-BLCA datasets. (b) The expression profile of LINC00839 in paired bladder cancer tissues and normal tissues, obtained from TCGA-BLCA datasets. (c) q-PCR analysis of the LINC00839 expression in the indicated bladder cancer cell lines. The expression of LINC00839 was normalized to its expression in BdEC cell. The expression profile of LINC00839 in different T (d), N (e), M (f) stages obtained from TCGA-BLCA datasets. The expression profile of LINC00839 in different pathologic stages (g) and histologic grades (h) obtained from TCGA-BLCA datasets. (i) q-PCR analysis of LINC00839 in the bladder cancer patients derived tissues from the indicated TNM stages. The expression of LINC00839 was normalized to its expression in the normal tissues. *p < .05, **p < .01, ***p < .001, ****p < .0001.
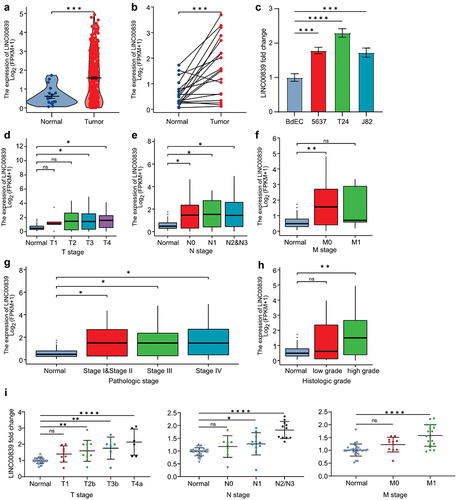
Figure 2. LINC00839 promotes the migration, invasion and EMT of bladder cancer cells.
(a) The expression of CDH1 and VIM was determined by q-PCR analysis following the ectopic expression of LINC00839 for 48 hours by the vector pcD-839 in T24 and J82 cells (n = 3). (b) The expression of CDH1 and VIM was determined by q-PCR analysis following the silencing LINC00839 for 48 hours by the specific siRNA pools in T24 and J82 cell (n = 3). (c) Left panel: The migration rate of T24 cells was evaluated by wound-healing assay after transfected cells with pcD-839 vector for 48 hours. The quantification of migration rate is presented. Scale bar: 100 µm. Right panel: The invasion rate of T24 cells was evaluated by Transwell assay after transfected cells with pcD-839 vector for 48 hours. The quantification of invasion rate is presented (n = 3). Scale bar: 60 µm (d) Left panel: The migration rate of T24 cells was evaluated by wound-healing assay after transfected cells with LINC00839 siRNA pool for 48 hours. The quantification of migration rate is presented. Scale bar: 100 µm. Right panel: The invasion rate of T24 cells was evaluated by Transwell assay after transfected cells with LINC00839 siRNA pool for 48 hours. The quantification of invasion rate is presented (n = 3). Scale bar: 60 µm. The proliferation ability of T24 cells was determined by MTT assay after transfected cells with pcD-839 vector (e) and LINC00839 siRNA (f) respectively at the indicated time points (n = 3). (g) The IC50 of Gemcitabine in T24 cells was determined by MTT assay. (h) The proliferation rate of T24 cells was determined by MTT assay following the indicated treatments and at the indicated time points (n = 3). The final concentration of Gemcitabine is 0.1 µM. (i) The colony formation capability of T24 cells following the indicated treatments (n = 3). The final concentration of Gemcitabine is 0.1 µM. *p < .05, **p < .01.
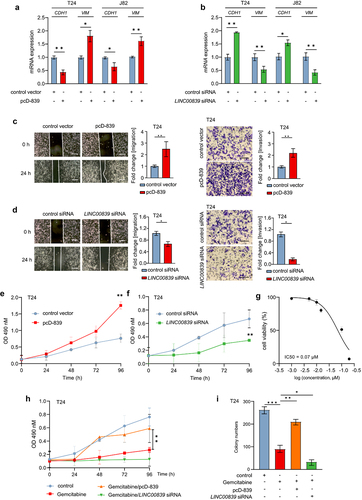
Figure 3. LINC00839 is a direct target of EGR1.
(a) The scheme of EGR1 ChIP analysis from two cell lines was modified from UCSC genome browser. The ChIP peaks of EGR1 on the promoter of LINC00839 are highlighted, and the binding motif was indicated. (b) The probability of binding motif was obtained from JASPAR online database. (c) The target between LINC00839 and EGR1 was validated by q-ChIP analysis (n = 3). 16q22 served as a negative control. (d) The expression of LINC00839 was determined by qPCR analysis after transfected T24 and J82 cells with pcD-EGR1 vector for 48 hours (n = 3). (e) Left panel: The expression profile of EGR1 in unpaired bladder cancer tissues and normal tissues, obtained from TCGA-BLCA datasets. Right panel: The expression profile of EGR1 in paired bladder cancer tissues and normal tissues, obtained from TCGA-BLCA datasets. (f) The expression profile of EGR1 in different T, N, M stages obtained from TCGA-BLCA datasets. The expression profile of EGR1 in different histologic grades obtained from TCGA-BLCA datasets. (g) The expression profile of EGR1 in different pathologic stages obtained from TCGA-BLCA datasets. (h-j) q-PCR analysis of EGR1 in the bladder cancer patients derived tissues from the indicated TNM stages. The expression of EGR1 was normalized to its expression in the normal tissues. *p < .05, **p < .01, ***p < .001, ****p < .0001.
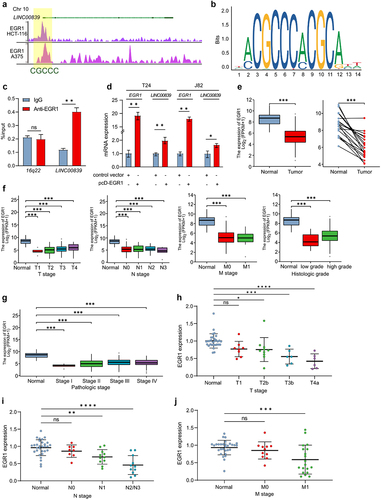
Figure 4. EGR1 represses migration and invasion of bladder cancer cells.
(a) The expression of CDH1, VIM and SNAI1 was determined by q-PCR analysis following the ectopic expression of EGR1 for 48 hours by the vector pcD-EGR1 in T24 and J82 cells (n = 3). (b) The expression of CDH1,VIM and SNAI1 was determined by q-PCR analysis following the silencing EGR1 for 48 hours by the specific siRNA pools in T24 and J82 cell (n = 3). (c) Left panel: The migration rate of T24 cells was evaluated by wound-healing assay after transfected cells with pcD-EGR1 vector for 48 hours. The quantification of migration rate is presented. Right panel: The invasion rate of T24 cells was evaluated by Transwell assay after transfected cells with pcD-EGR1 vector for 48 hours. The quantification of invasion rate is presented (n = 3). (d) Left panel: The migration rate of T24 cells was evaluated by wound-healing assay after transfected cells with EGR1 siRNA pool for 48 hours. The quantification of migration rate is presented. Scale bar: 100 µm. Right panel: The invasion rate of T24 cells was evaluated by Transwell assay after transfected cells with EGR1 siRNA pool for 48 hours. Scale bar: 60 µm. The quantification of invasion rate is presented (n = 3). *p < .05, **p < .01.
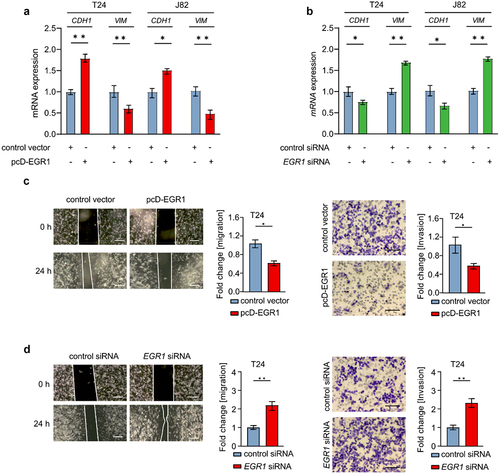
Figure 5. LINC00839 interacts with miR-142.
(a) The scheme of miR-142 target on the 3’UTR of LINC00839, which was obtained and modified from TargetScan. The mutation strategy was indicated by color green. (b) The target between miR-142 and LINC00839 was validated by luciferase assay in T24 cells after the indicated transfections (n = 3). (c) The expression of LINC00839 determined by q-PCR analysis after transfected T24 and J82 cells with miR-142 mimic for 48 hours (n = 3). (d) The expression of miR-142 determined by q-PCR analysis after transfected T24 and J82 cells with pcD-839 vector for 48 hours (n = 3). (e-g) q-PCR analysis of miR-142 in the bladder cancer patients derived tissues from the indicated TNM stages. (h) q-PCR analysis of the miR-142 expression in the indicated bladder cancer cell lines (n = 3). The expression of miR-142 was normalized to its expression in BdEC cell. **p < .01, ***p < .001, ****p < .0001.
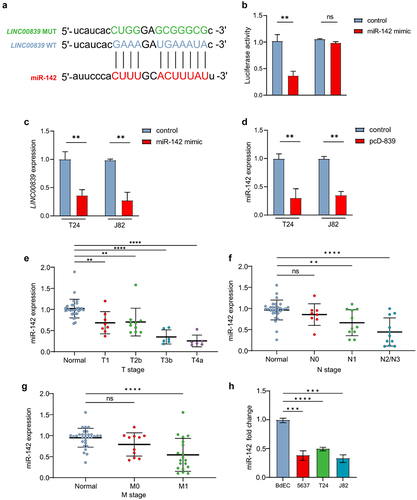
Figure 6. LINC00839/miR-142 axis modulates the expression of SOX5.
(a) The target between miR-142 and SOX5 was validated by luciferase assay in T24 cells after the indicated transfections (n = 3). (b) The expression of SOX5 mRNA determined by q-PCR analysis after transfected T24 and J82 cells with miR-142 mimic for 48 hours (n = 3). (c) The expression of SOX5 protein determined by western blot analysis after transfected T24 and J82 cells with miR-142 mimic for 48 hours (n = 3). (d) The expression of miR-142 determined by q-PCR analysis after transfected T24 and J82 cells with pcD-SOX5 vector for 48 hours (n = 3). (e) The expression of SOX5 mRNA determined by q-PCR analysis after transfected T24 and J82 cells with pcD-839 vector for 48 hours (n = 3). (f) The expression of SOX5 protein determined by western blot analysis after transfected T24 and J82 cells with pcD-839 vector for 48 hours (n = 3). (g) The expression of SOX5 mRNA determined by q-PCR analysis after transfected T24 and J82 cells with the indicated vector and RNA for 48 hours (n = 3). (h) The expression of SOX5 protein determined by western blot analysis after transfected T24 and J82 cells with the indicated vector and RNA for 48 hours (n = 3). **p < .01.
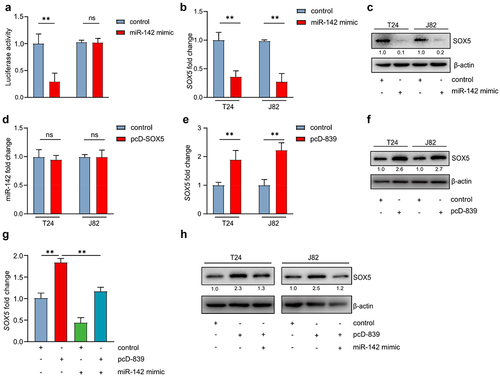
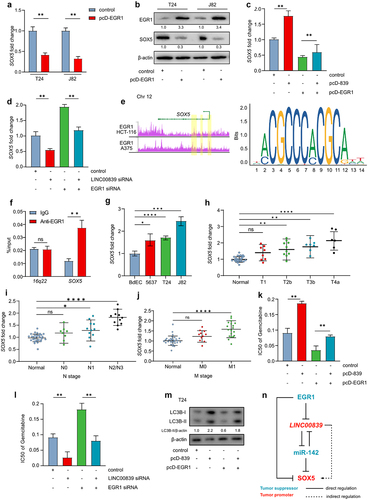
Figure 7. EGR1 suppresses SOX5 via a coherent feed-forward loop.
(a) The expression of SOX5 mRNA determined by q-PCR analysis after transfected T24 and J82 cells with pcD-EGR1 vector for 48 hours (n = 3). (b) The expression of SOX5 protein determined by western blot analysis after transfected T24 and J82 cells with pcD-EGR1 vector for 48 hours (n = 3). (c) and (d) The expression of SOX5 mRNA determined by q-PCR analysis after transfected T24 and J82 cells with the indicated vectors for 48 hours. (e) Left panel: The scheme of EGR1 ChIP analysis from two cell lines was modified from UCSC genome browser. The ChIP peaks of EGR1 on the promoter of SOX5 are highlighted. Right panel: The probability of binding motif was obtained from JASPAR online database. (f) The target between SOX5 and EGR1 was validated by q-ChIP analysis (n = 3). 16q22 served as a negative control. (g) q-PCR analysis of the SOX5 expression in the indicated bladder cancer cell lines (n = 3). The expression of SOX5 was normalized to its expression in BdEC cell. (h-i) q-PCR analysis of SOX5 in the bladder cancer patients derived tissues from the indicated TNM stages. (k-l) The IC50 (µM) of Gemcitabine in T24 cells was determined by MTT assay after the indicated treatments. (m) LC3B-II was determined by western blot following the indicated treatments in T24 cells. (n) The regulation model of EGR1/LINC00839/SOX5 coherent feed-forward loop. *p < .05, **p < .01, ***p < .001, ****p < .0001.
Supplemental material