
Figures & data
Table 1. The characteristics of patients with osteosarcoma.
Table 2. Real-time PCR primer sequences.
Figure 1. High expression level of circ_0020378 in osteosarcoma.
a. circ_0020378 expression in osteosarcoma tissues and the matched uncarcinomas tissues were detected by RT-qPCR analysis. b. circ_0020378 expression in four osteosarcoma cells (SW1353, Saos-2 and HOS) and hFOB1.19 were detected by RT-qPCR. **P < .001, vs. hFOB1.19. c. The cytoplasmic and nucleus circ_0020378 expression in Saos-2 and HOS cells was examined by RT-qPCR. d. The circ_0020378 expression in Saos-2 and HOS cells after treated by RNase R or not was detected by RT-qPCR. **P < .001, vs. control.
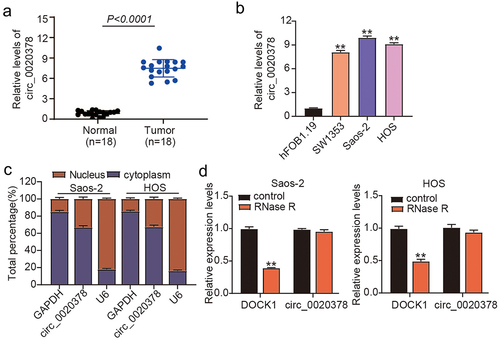
Figure 2. circ_0020378 silence elicits anti-tumor activity to osteosarcoma in vitro and in vivo.
a. RT-qPCR analysis to determine silencing efficiency of Circ_0020378 in Saos-2 and HOS cells after transfected with si-NC and si-circ. b. The effect of Circ_0020378 silence on osteosarcoma cellular proliferation in Saos-2 and HOS cells by CCK8 assay. c. Transwell migration assay was conducted to detect the migration of Saos-2 and HOS cells when Circ_0020378 silence or not. d. The colony formation of Saos-2 and HOS cells driven by si-circ or si-NC was detected by colony formation assay. e. Xenograft growth of Saos-2 cells with sh-circ and circ-NC. The photography of xenograft tumors after 35 days subcutaneously injecting with Saos-2 cells with sh-circ or sh-NC. Volume and weight of the xenograft tumors were measured. **P < .001, vs. si-NC or sh-NC.
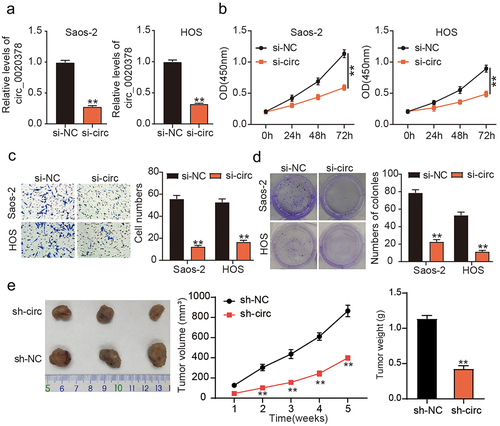
Figure 3. Circ_0020378 targets miR-339-3p.
a. CircInteractome (https://circinteractome.nia.nih.gov) was used to clarify the base pairing between circ_0020378 and miR-339-3p. b. The luciferase activity mediated by circ_0020378-WT or circ_0020378-MUT was detected in Saos-2 and HOS cells with miR-339-3p mimic or not. **P < .001, vs. miR-NC. c. Cell lysates of Saos-2 and HOS cells were immunoprecipitated with an antibody against IgG and Ago2, and the expression of circ_0020378 and miR-339-3p was detected by RT-qPCR. **P < .001, vs. Anti-IgG. d. RT-qPCR analysis of miR-339-3p expression in osteosarcoma tissues and normal tissues. e. RT-qPCR analysis of miR-339-3p expression in osteosarcoma cells (Saos-2 and HOS) and hFOB1.19 cells. **P < .001, vs. hFOB1.19. F. Pearson analysis of the expression of circ_0020378 and miR-339-3p in osteosarcoma tissues.
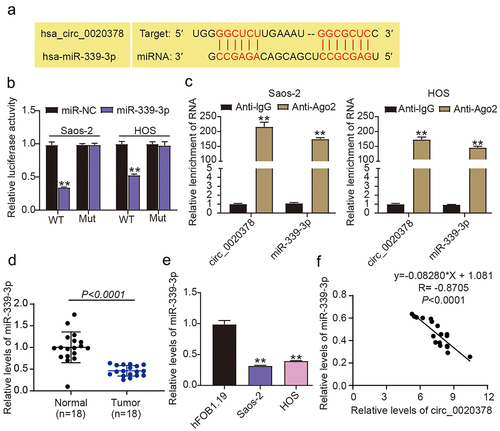
Figure 4. Circ_0020378 silence disrupts the tumor-promoting effect of miR-339-3p inhibitor in osteosarcoma cells.
a. RT-qPCR analysis of miR-339-3p expression in Saos-2 and HOS cells with simultaneous downregulation of circ_0020378 and miR-339-3p as well as their control cells. b. CCK8 assay assessing the Saos-2 and HOS cellular proliferation when transfected with si-NC, inhibitor-NC, inhibitor, si-circ, and si-circ+inhibitor. c. Transwell migration assay determining the migration of Saos-2 and HOS cells when transfected with si-NC, inhibitor-NC, inhibitor, si-circ, and si-circ+inhibitor. d. colony formation assay determining the colony formation of Saos-2 and HOS cells when transfected with si-NC, inhibitor-NC, inhibitor, si-circ, and si-circ+inhibitor., **P < .001, vs. si-NC; ##P < .001, vs. inhibitor-NC; &&P < .001, vs. si+inhibitor.
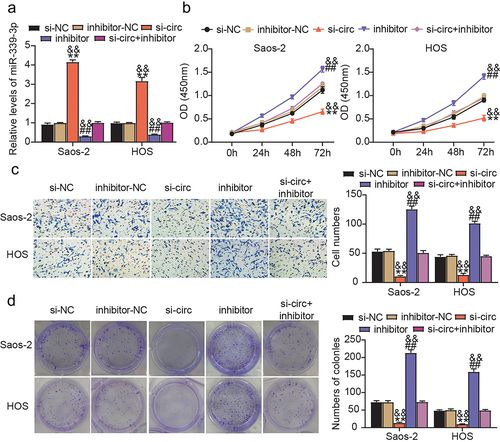
Figure 5. MiR-339-3p targets COL1A1.
a. COL1A1 was a target of miR-339-3p predicted by TargetScan (www.targetscan.org). b. Detection of luciferase activity by luciferase reporter system in Saos-2 and HOS cells concurrently transfected with COL1A1 WT and MUT luciferase reporters and miR-339-3p mimic (miR-339-3p) or mimic NC (miR-NC). **P < .001, vs. miR-NC. c. The expression of COL1A13 was detected by RT-qPCR in 10 pairs of osteosarcoma tissues and normal tissues. d. Detection of COL1A13 by RT-qPCR in osteosarcoma cells (Saos-2 and HOS) and hFOB1.19 cells. ** P < .001, vs. hFOB1.19. e. Pearson’s analysis verifying the correlation of COL1A13 and miR-339-3p in 10 osteosarcoma tissues. f-G. RT-qPCR (f) and western blot (g) assays detected the COL1A1 expression in osteosarcoma cells (Saos-2 and HOS) transfected with miR-339-3p mimic (miR-339-3p) or miR-339-3p inhibitor. **P < .001, vs. miR-NC; ##P < .001, vs. inhibitor-NC.
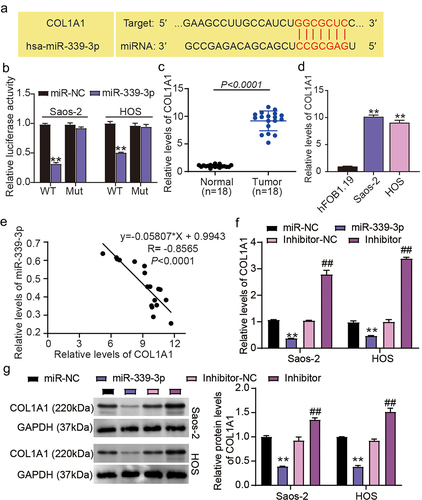
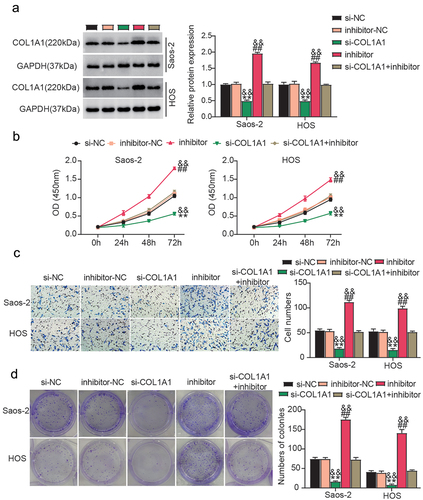
Figure 6. miR-339-3p attenuates the malignant phenotypes of osteosarcoma cells by downregulating COL1A1.
a. Western blot analyzing COL1A1 expression in Saos-2 and HOS cells transfected with si-NC, inhibitor-NC, si-COL1A1, inhibitor, si-COL1A1+inhibitor. b. CCK8 assay assessing the Saos-2 and HOS cellular proliferation when Saos-2 and HOS cells transfected with si-NC, inhibitor-NC, si-COL1A1, inhibitor, si-COL1A1+inhibitor. c. Transwell migration assay determining the migration of Saos-2 and HOS cells transfected with si-NC, inhibitor-NC, si-COL1A1, inhibitor, si-COL1A1+inhibitor. d. colony formation assay determining the colony formatting of Saos-2 and HOS cells transfected with si-NC, inhibitor-NC, si-COL1A1, inhibitor, si-COL1A1+inhibitor. **P < .001, vs. si-NC; ##P < .001, vs. inhibitor-NC; &&P < .001, vs. si+inhibitor.
Data availability statement
All data generated or analyzed during this study are included in this published article.