
Figures & data

Figure 1. Increasing PD-1 and Tim-3 on IFN-γ+ T cell subsets in PB in AML.
a Detection of PD-1+, Tim-3+, and PD-1+Tim-3+ on IFN-γ+ T cell subsets in a patient with de novo AML and healthy individuals by flow cytometry.
b tSNE clusters of the global distribution and frequency of different T cell phenotypes in patients with de novo AML and healthy individuals.
c Different patterns of PD-1 and Tim-3 expression in IFN-γ+ T cell subsets in the de novo AML and HI groups.
d-f Frequency of PD-1 (d), Tim-3 (e) expression, and co-expression (f) in the IFN-γ+CD3+/CD4+/CD8+ T cells in the de novo AML and HI groups.
g Correlation between the percentages of PD-1 and Tim-3 in IFN-γ+ T cell subsets in de novo AML patients.
h Heat map representing the frequency of PD-1+, Tim-3+, and PD-1+Tim-3+ cells on IFN-γ+ T cell subsets from patients with de novo AML compared with HIs.
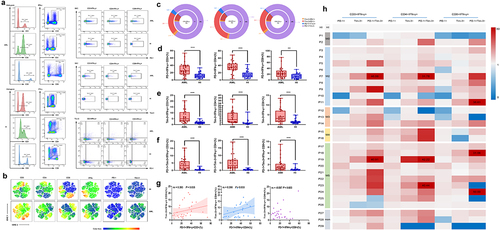
Figure 2. Higher PD-1 and Tim-3 on IFN-γ+ T cell subsets are related with poor prognosis in AML.
a-c Comparison of the percentages of PD-1+ (A), Tim-3+ (B), and PD-1+Tim-3+ cells (C) in the IFN-γ+ T cell subsets in the de novo AML and HI groups.
d-e Overall survival (OS) analysis of PD-1+IFN-γ+CD3+ T cells and PD-1+IFN-γ+CD8+ T cells in de novo AML cohort.
f-h ROC curve predicting the relationship between PD-1+ (f), Tim-3+ (g), and PD-1+Tim-3+ cells (h) on IFN-γ+ T cell subsets and whether they achieved CR after the first course of treatment.
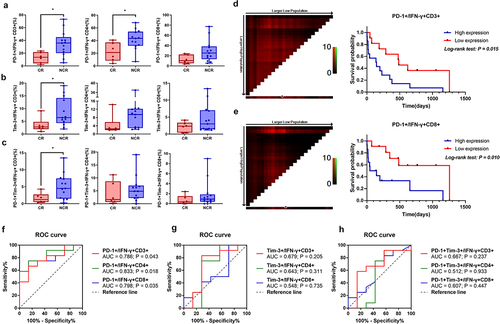
Figure 3. Distribution and frequency of PD-L1/PD-L2/Gal-9/Tim-3 in AML cells in PB and BM.
a Detection of PD-L1+, PD-L2+, Gal-9+, and Tim-3+ in CD117+HLA-DR+/CD117+CD34+ AML cells in a patient with de novo AML using flow cytometry.
b Comparison of the percentages of PD-L1+, PD-L2+, Gal-9+, and Tim-3+ in CD117+HLA-DR+/CD117+CD34+ AML cells in PB and BM.
c-d Comparison of the percentages of PD-L1+, PD-L2+, Gal-9+, and Tim-3+ in CD117+HLA-DR+/CD117+CD34+ AML cells in PB between the CR and NCR groups.
e Correlation between the percentages of PD-L1+, PD-L2+, Gal-9+, and Tim-3+ in AML cells and PD-1 and Tim-3 in IFN-γ+ T cells in PB in de novo AML.
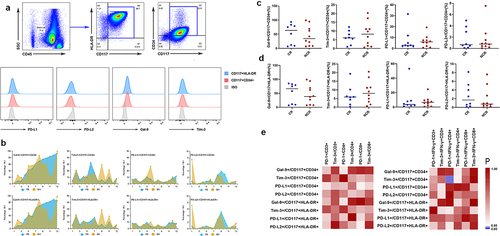
Figure 4. The characteristics of the secretory cytokines in ICI-treated T cells in vitro detected by protein chip.
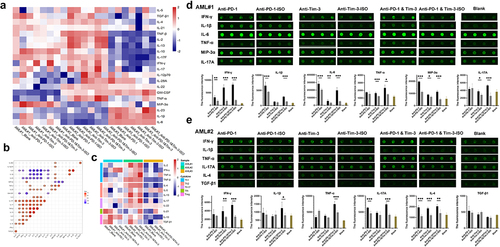
a Heatmap representing the mean fluorescence intensity of 20 cytokines in the BM (n = 3) of AML patients (AML#1, AML#2, AML#3) treated with ICI compared with the isotype.
b Correlation between secretory cytokines in T cells co-cultured with AML cells in vitro in BM (n = 3). All points shown in the figure are significantly correlated (P <.05). Blue indicates a negative correlation and red indicates a positive correlation.
c Heatmap representing the characteristics of the main cytokines in different secretory T cell subsets treated with ICI in the BM (n = 3) in de novo AML.
d-e Comparison of the secretory cytokines (mean fluorescence intensity) in T cells treated with anti-PD-1, anti-Tim-3, and ICI combination in AML#1 patients and AML#2 patients detected by protein chip
Supplemental material