Figures & data
Table 1. The different treatment/control groups included for each designated co-culture setup. All treatments were conducted for 24 h.
Figure 1. Cell proliferation of Panc 10.05 and SW 1990 cells co-cultured with macrophages under LPS-stimulated inflammation with or without ATP and MCC950.
Figure 2. Levels of cytokine a) IL-1β and b) TNF-α production by i) Panc 10.05 PDAC cells and ii) SW 1990 PDAC cells co-cultured with macrophages under LPS-stimulated inflammation, with or without ATP and MCC950.
Figure 3. Levels of cytokines i) IL-1β and ii) TNF-α production by RAW 264.7 macrophages in the co-cultures A) Panc 10.05 PDAC cells/RAW 264.7 macrophages and B) SW 1990 PDAC cells/RAW 264.7 macrophages, under LPS- and ATP-induced inflammation with or without NLRP3 inhibition by MCC950.
Figure 4. Relative protein expression levels of NLRP3 inflammasome by a) Panc 10.05 and b) SW 1990 PDAC cells in their respective co-cultures with RAW 264.7 macrophages under LPS and ATP-induced inflammation with or without MCC950 inhibition were analysed using Western blot.
Figure 5. Relative levels of NLRP3 inflammasome by macrophages when co-cultured with a) Panc 10.05 cells and b) SW 1990 cells under LPS-stimulated inflammation with or without ATP and MCC950. Proteins in cell lysates of each treatment were subjected to the Western blot analysis.
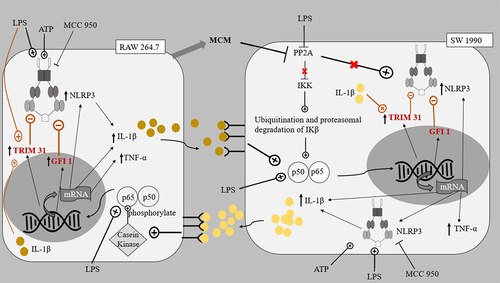
Figure 6. The proposed pathways of interaction between Panc 10.05 PDAC cells and RAW 264.7 macrophages.
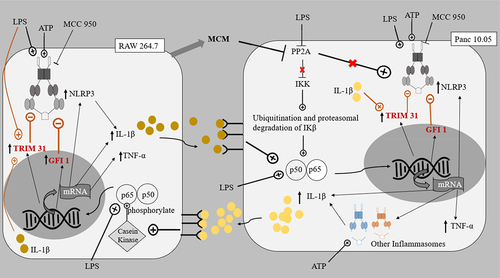
Figure 7. The proposed pathways of interaction between SW 1990 PDAC cells and RAW 264.7 macrophages.