
Figures & data
Figure 1. Conformation 1 determined for the p53 monomer. (a) the newly refined p53 structure had ~82% occupancy of the protein backbone and side chain residues within the EM map and slices through the map and model (1–3) highlight some of the fit residues. (b) Spatial resolution (~5.8-Å) was estimated at the FSC-0.143 value (green line) for half map comparisons employing the PDB validation server and the EMDB server. Both curves are shown for comparison. (c, d) the Q-score and atom inclusion values were 0.1280 and 0.8260 and are shown mapped to the model with scale values ranging from 0.0 (red) to 1.0 (cyan).
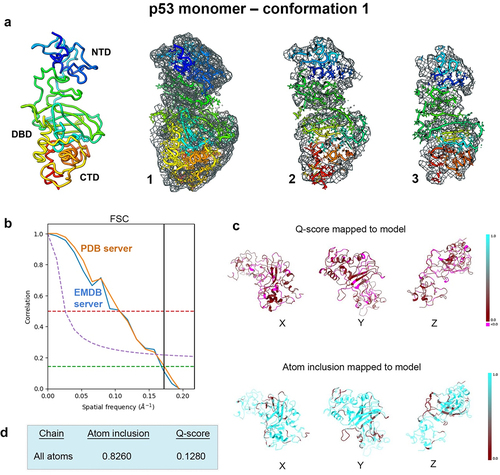
Figure 2. Evaluating conformation 2 determined for the p53 monomer. (a) the second refined model was fit in the EM map having ~81% occupancy of the c-α backbone and side chain residues, and slices through the map and model (1–3) highlight some of the fit residues. (b) Spatial resolution (~5.8-Å) was estimated according to the FSC-0.143 value (green line) calculated using the PDB validation server and the EMDB server. (c, d) the Q-score and atom inclusion values were 0.1210 and 0.8170, respectively, and are shown mapped to the model with scale values ranging from 0.0 (red) to 1.0 (cyan).
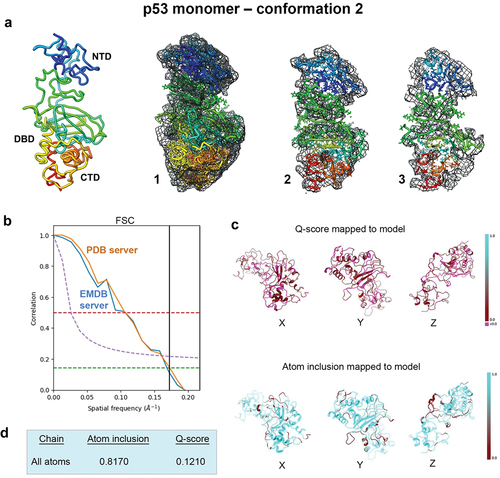
Table 1. Model refinement and validation.
Figure 3. Side-by-side comparison of the refined p53 monomer models focusing on the N-terminal domain (NTD). Model alignments were evaluated for the starting model (PDB code, 8F2I, yellow) with respect to the two new refined models using the Chimera program and structure comparison tools. Differences in c-alpha backbones were quantified using RMSD values. Conformation 1 is in dark blue while conformation 2 is colored light blue.
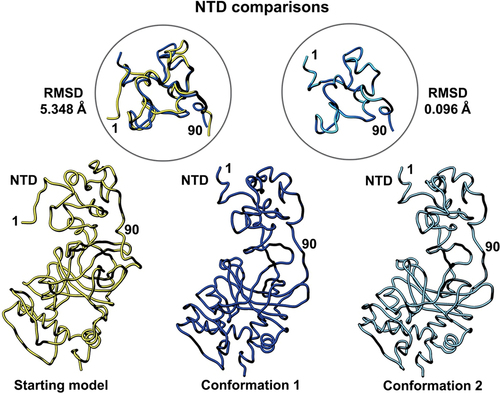
Figure 4. Side-by-side comparison of the refined p53 monomer models highlighting the DNA binding domain (DBD). Model alignments were evaluated for the starting model (PDB code, 8F2I, yellow) with respect to the two newly refined models using the Chimera program and structure comparison tools. Differences in c-alpha backbones were quantified using RMSD values. Conformation 1 is in dark blue while conformation 2 is colored light blue.
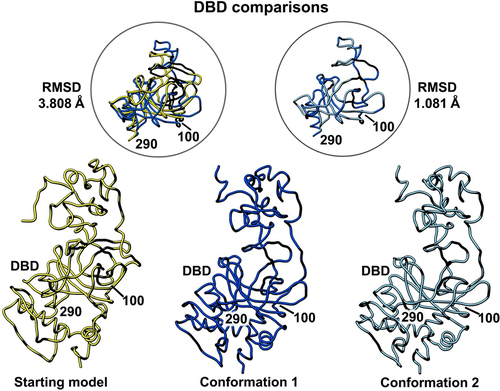
Figure 5. Side-by-side comparison of the refined p53 monomer models emphasizing the C-terminal domain (CTD). Model alignments were evaluated for the starting model (PDB code, 8F2I, yellow) with respect to the two new refined models using the Chimera program and the structure comparison tools. Differences in c-alpha backbones were quantified using RMSD values. Conformation 1 is in dark blue while conformation 2 is colored light blue.
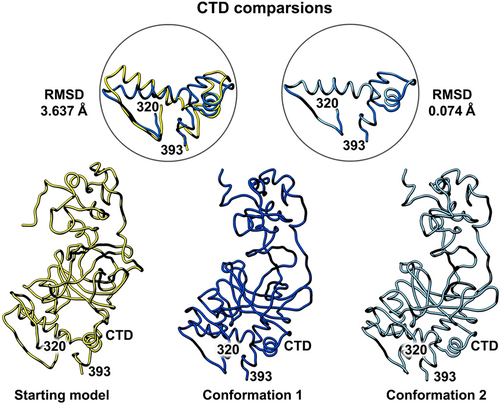
Figure 6. Time series RMSD analysis of simulated trajectories for p53 monomers. (a) the different model conformations were plotted over 1000 ns with the starting model in blue, conformation 1 in red, and conformation 2 in orange. Lower RMSD values indicate a lower deviation from the starting model (reference structure) whereas higher RMSD values indicates a higher deviation of the conformers generated throughout the simulation. (b) superimposition of simulated snapshots (cyan) with their respective reference structures (purple) show domain displacements, particularly in N terminal region. The first row illustrates the superimposition of the starting model and its simulated conformers. The second row illustrates the superimposition of conformation 1 and its simulated conformers while the third row illustrates the superimposition of conformation 2 and its simulated conformers.
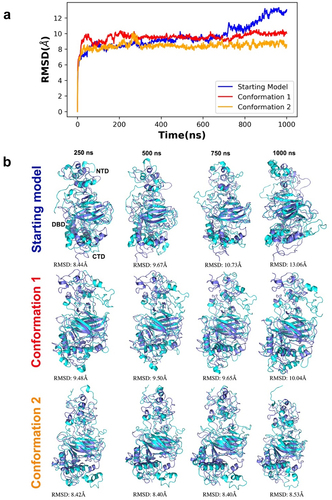
Figure 7. RMSF analysis of the alpha carbon atoms for p53 monomers. A comparison of the different p53 monomer conformations is plotted across all c-alpha atoms with the starting model in blue and conformations 1 and 2 colored red and orange, respectively. Higher fluctuations of RMSF values indicates higher residual flexibility, whereas lower fluctuations of RMSF values indicates lower residual flexibility.
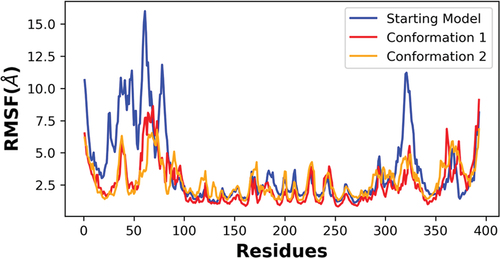
Figure 8. Conformation 1 of the refined p53 dimer model. (a) the refined model of the p53 dimer fit in the EM map. Slices through the map and model highlight some of the fit residues within the map. (b) Spatial resolution (~4.4-Å) was estimated at the FSC-0.143 value (green line) employing the EMDB FSC server. The PDB server slightly over-estimated the resolution. (c,d) Q-scores for chains A, B were 0.1790 and atom inclusion values were 0.6200 and 0.6230, respectively and shown mapped to the model. Scale ranges from 0.0 (red) to 1.0 (cyan).
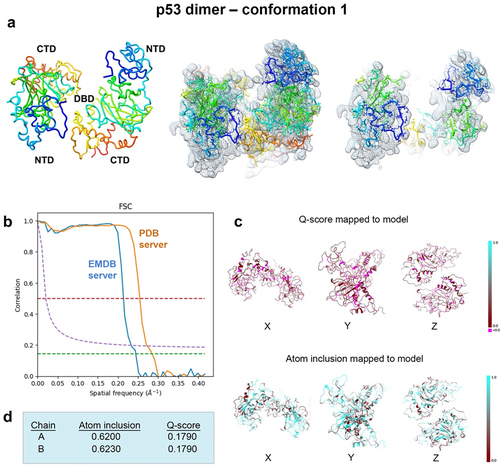
Figure 9. Conformation 2 of the refined p53 dimer model. (a) a second refined model of the p53 dimer is shown fit in the EM map and slices through complex highlight some of the fit residues in the map. (b) Spatial resolution (~4.4-Å) was estimated at the FSC-0.143 value (green line) for half map comparisons employing the EMDB FSC server. The PDB server slightly over-estimated the resolution. (c, d) Q-scores for chains A, B were 0.1730 and atom inclusion values were 0.6150 and 0.6190, respectively and shown mapped to the model. Scale ranges from 0.0 (red) to 1.0 (cyan).
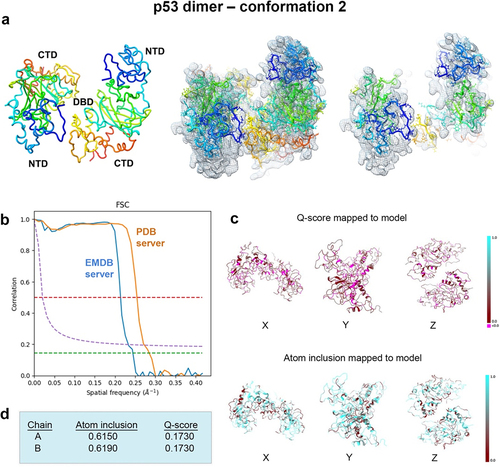
Figure 10. Side-by-side comparison of the refined p53 dimer models. Model alignments were evaluated for the starting model (PDB code, 8F2H, yellow) and the two new refined models for p53. Differences in the protein backbones were quantified by RMSD values. Conformations 1 (dark blue) and 2 (light blue) were most similar with minor backbone differences noted between the reference and the two new conformers.
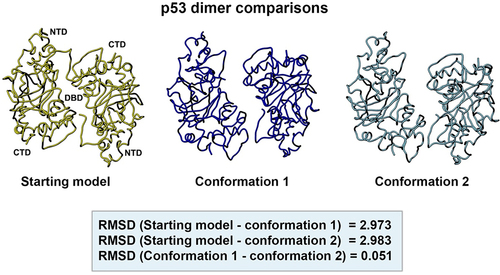
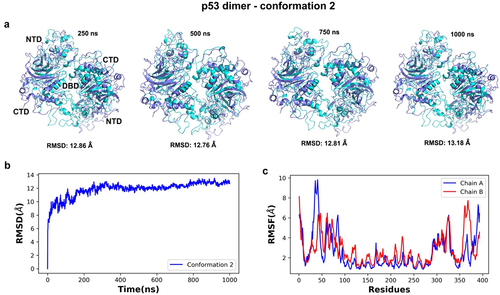
Figure 11. Time series and dynamic analyses of the simulated trajectory for conformation 2 of the p53 dimer. (a) superimposition of simulated snapshots (cyan) with the reference structure (purple) for conformer 2 showed residue displacements in N- and the C-terminal domains of both protein chains. (b) lower RMSD values after 400 ns of simulation indicate a lower deviation from the starting conformer after that timeframe and more stability throughout the simulation. (c) the RMSF analysis of alpha carbon atoms for the p53 dimers were plotted across all c-alpha atoms. Higher fluctuations were noted in the NTD and CTD (chains a and B) than in the central DBD regions of the dimer.
Links to supporting movies.docx
Download MS Word (7 KB)Data availability statement
Molecular structures related to this work have been deposited in the Protein Databank and will be released after publication. Additional data may be made available upon request at the discretion of the Principal Investigator.